Chapter 4 Exercises
-
Table E4-1 presents age frequency distributions for the projected 2020 population of India for men, women, and for both sexes together. Using these data, complete exercises a, b, and c by filling in the cells in the "India" column of Table E4-2 on the next page. Use the "Japan" column of that table as a model.

-
Compute the percentages of both sexes combined under fifteen years of age, fifteen through sixty-four, and sixty-five years and over. Round the percentages to two decimal places and enter these percentages in the spaces provided in Table E4-2 on the next page.
-
Compute the sex ratios for each of the three age categories, round to two decimal places, and enter in the spaces provided in Table e4-2.c
-
Compute the age-dependency ratio for both sexes together, round to one decimal place, and enter in the space provided in Table E4-2.
-
Table E4-3 classifies the projected population of India for 2050 by age and sex. Construct a population pyramid from these data, taking the following steps:
-
In the columns provided, enter the missing percentages. Remember that these percentages have as their denominators the total population of both sexes.
-
On the graph provided (Figure E4-1 on p. 138), draw a population pyramid, using the percentages in columns 3 and 4. Shade the area within the pyramid. Alternatively, you can construct the pyramid in Excel by following instructions here:
-
How would the Indian population pyramid for 2050 have differed from the one above if the assumptions employed had differed in the following ways?
-
If fertility had remained higher from 2020 to 2050, the average age of the population would have been
-
If mortality had declined to even lower levels and in equal proportion at all ages, the average age of the population would have been
-
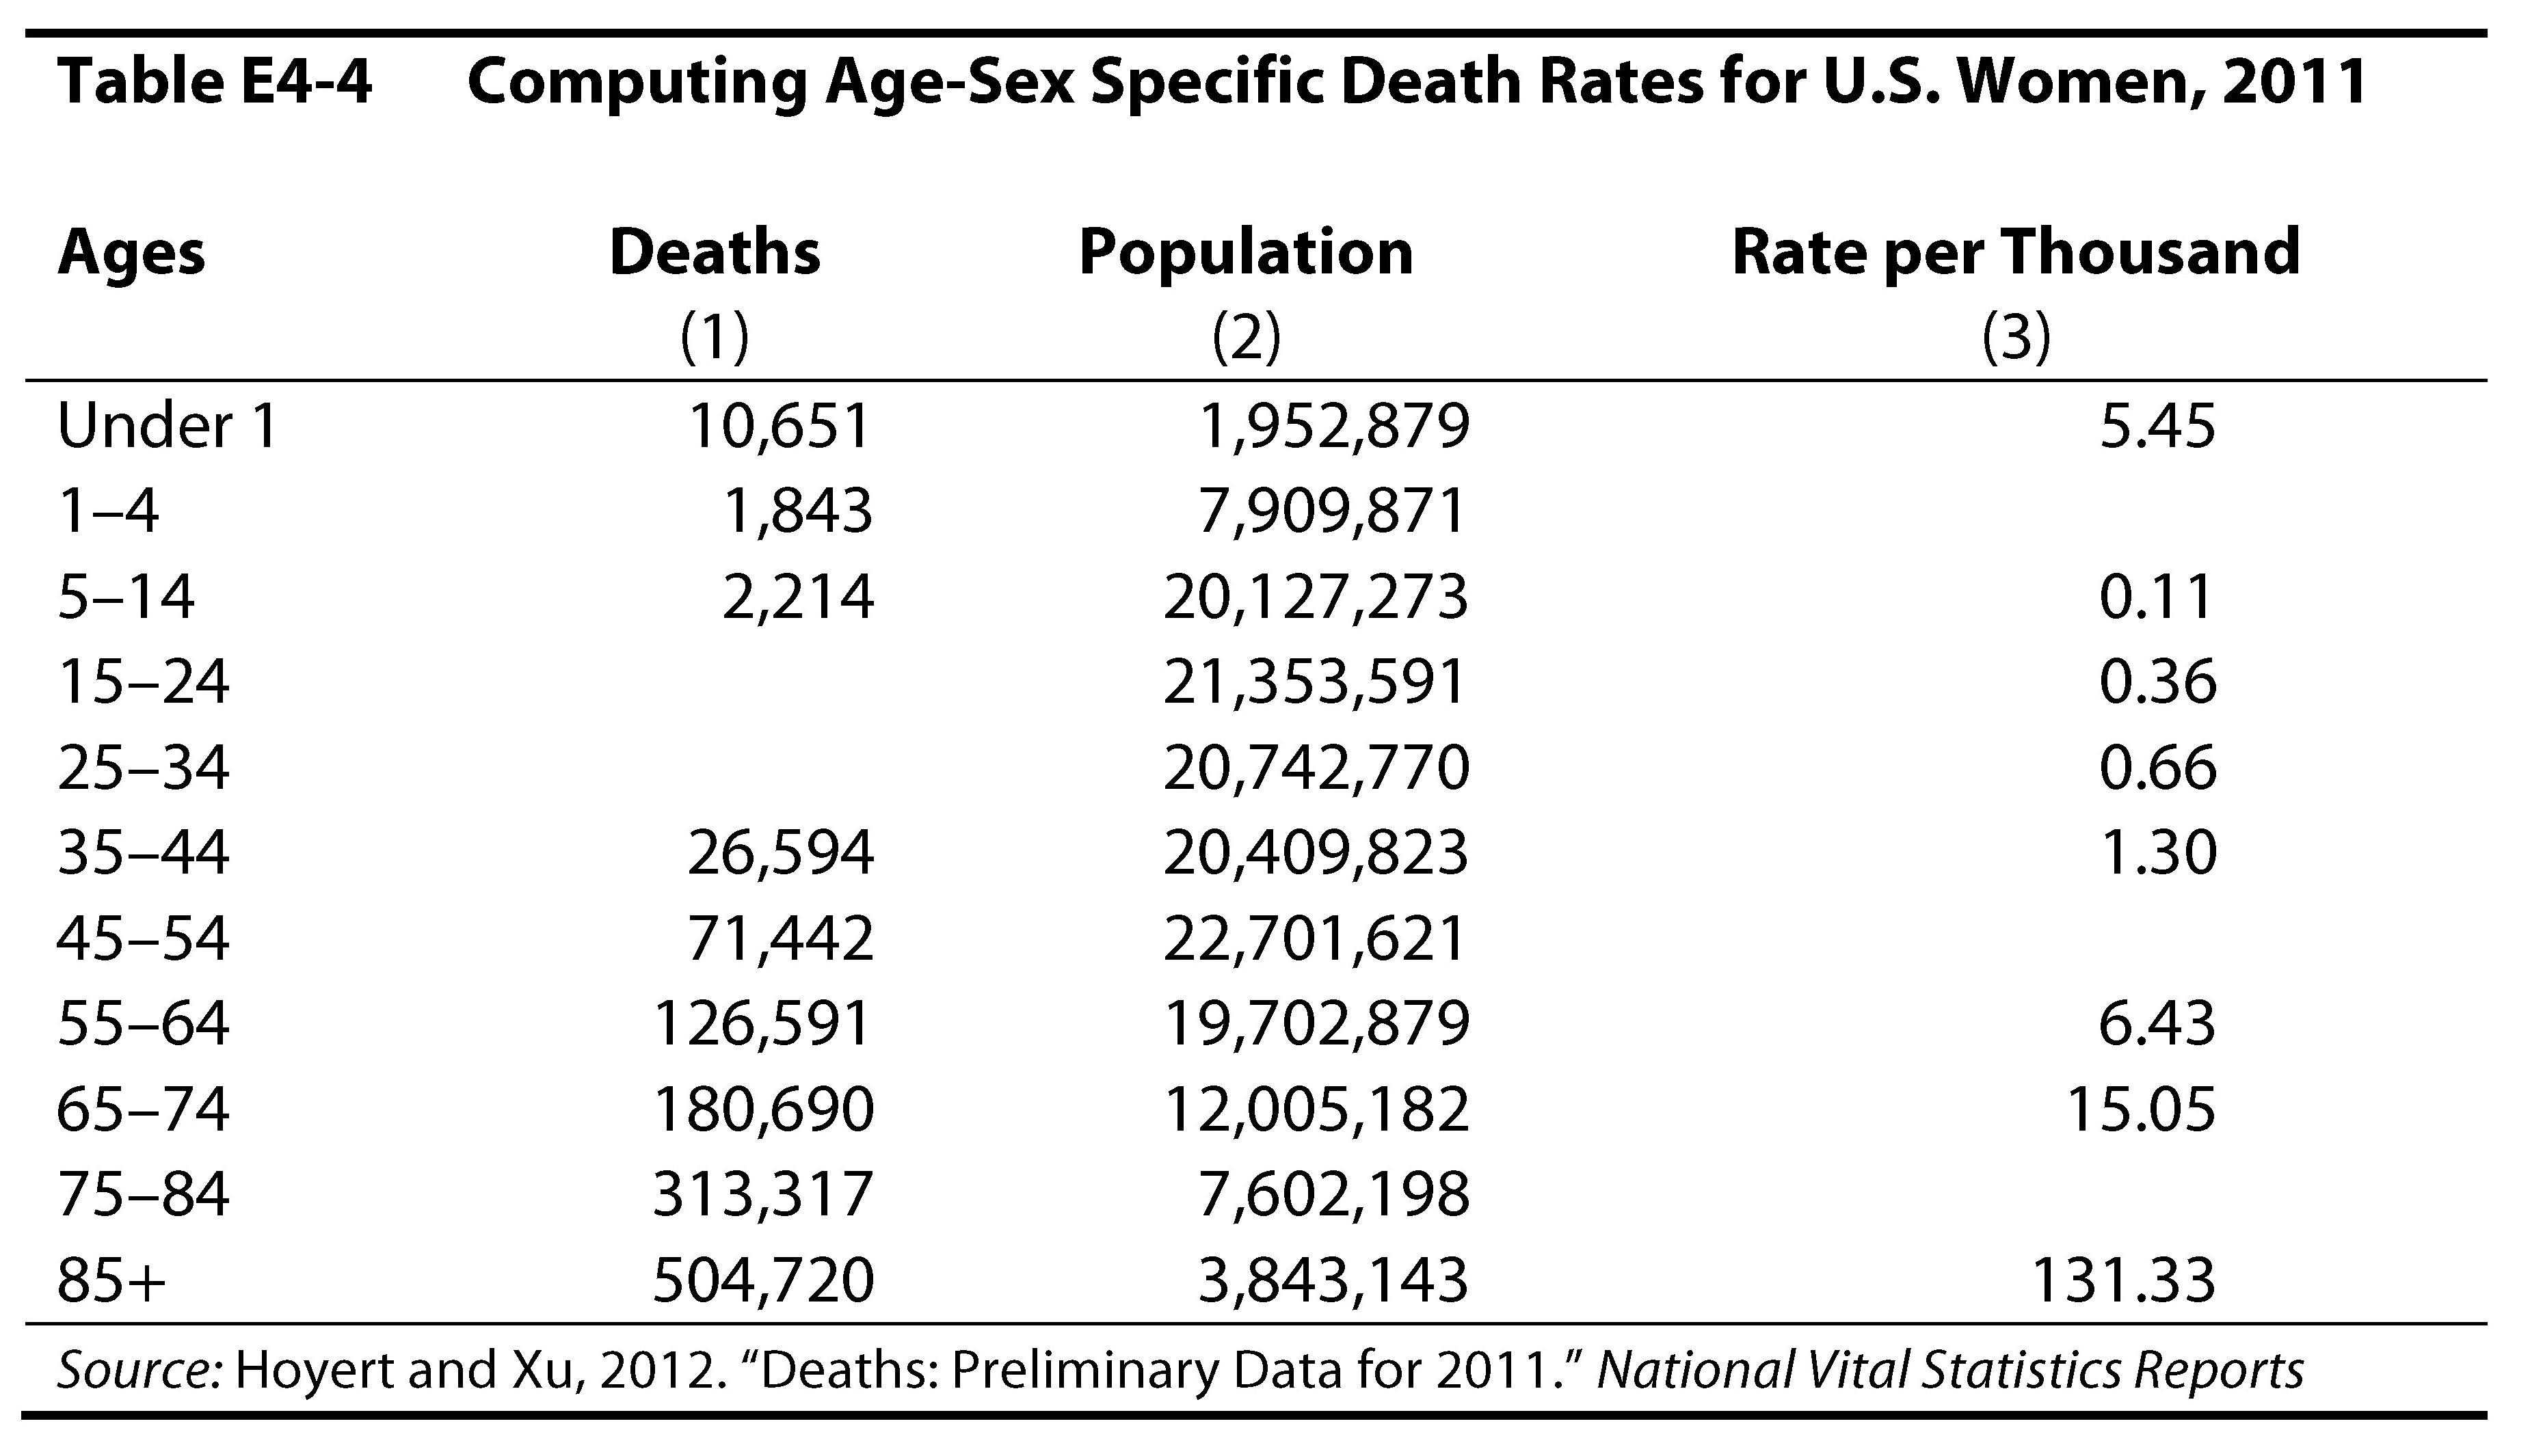
Practice constructing age-sex-specific rates for death. Table E4-4 on p. 139 presents the necessary data for U.S. women in 2011. For each age category, column 1 tells how many women of that age died in 2011, column 2 tells the estimated number of women of that age there were to die in 2011, and column 3 tells the age-sex-specific death rate (per thousand women). Thus, to get the rate for the 5–14 row, the 2,214 deaths were divided by the 2,012,727 existing women and then multiplied by 1,000, producing a death rate of 0.11 per thousand women. Compute rates for the three rows where rates have been omitted. (Refer to Box 4-2 for an explanation of age-sex- specific rates.)
-
Calculate the implications of age-sex-specific death rates found in Table E4-4. Where the number of deaths has been omitted from column 1, multiply the death rate by the population and divide by 1000 to estimate the number of deaths which would have produced the given death rate.
*We've discovered an error in our printed Table E4-4, please use the coreected version below the original one. We thank Margaret Gough (University of La Verne) for pointing out this error.
Charts
Figure 4.1
Figure 4.2
Figure 4.3
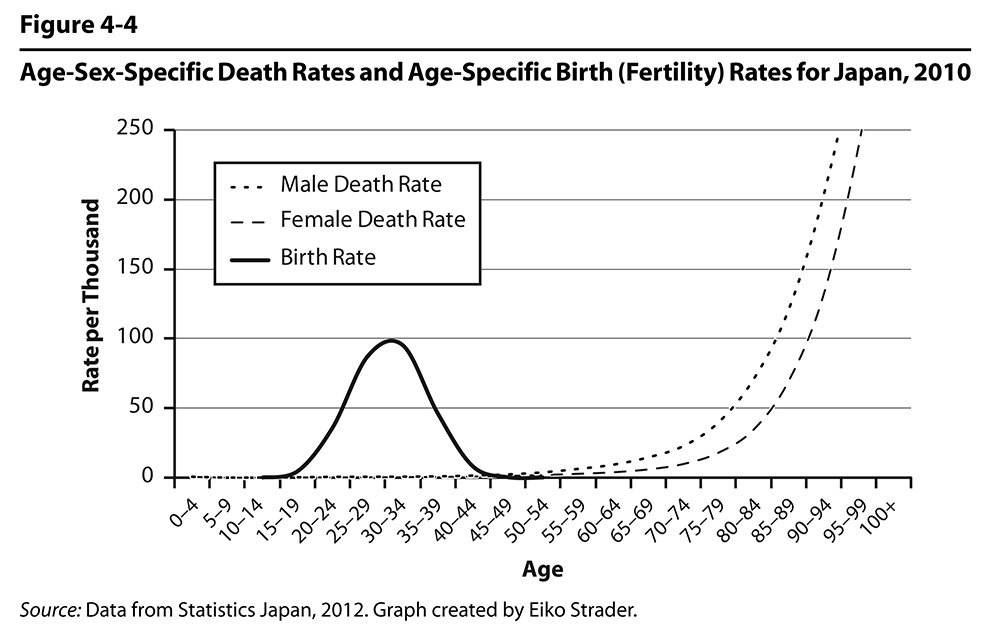
Figure 4.4
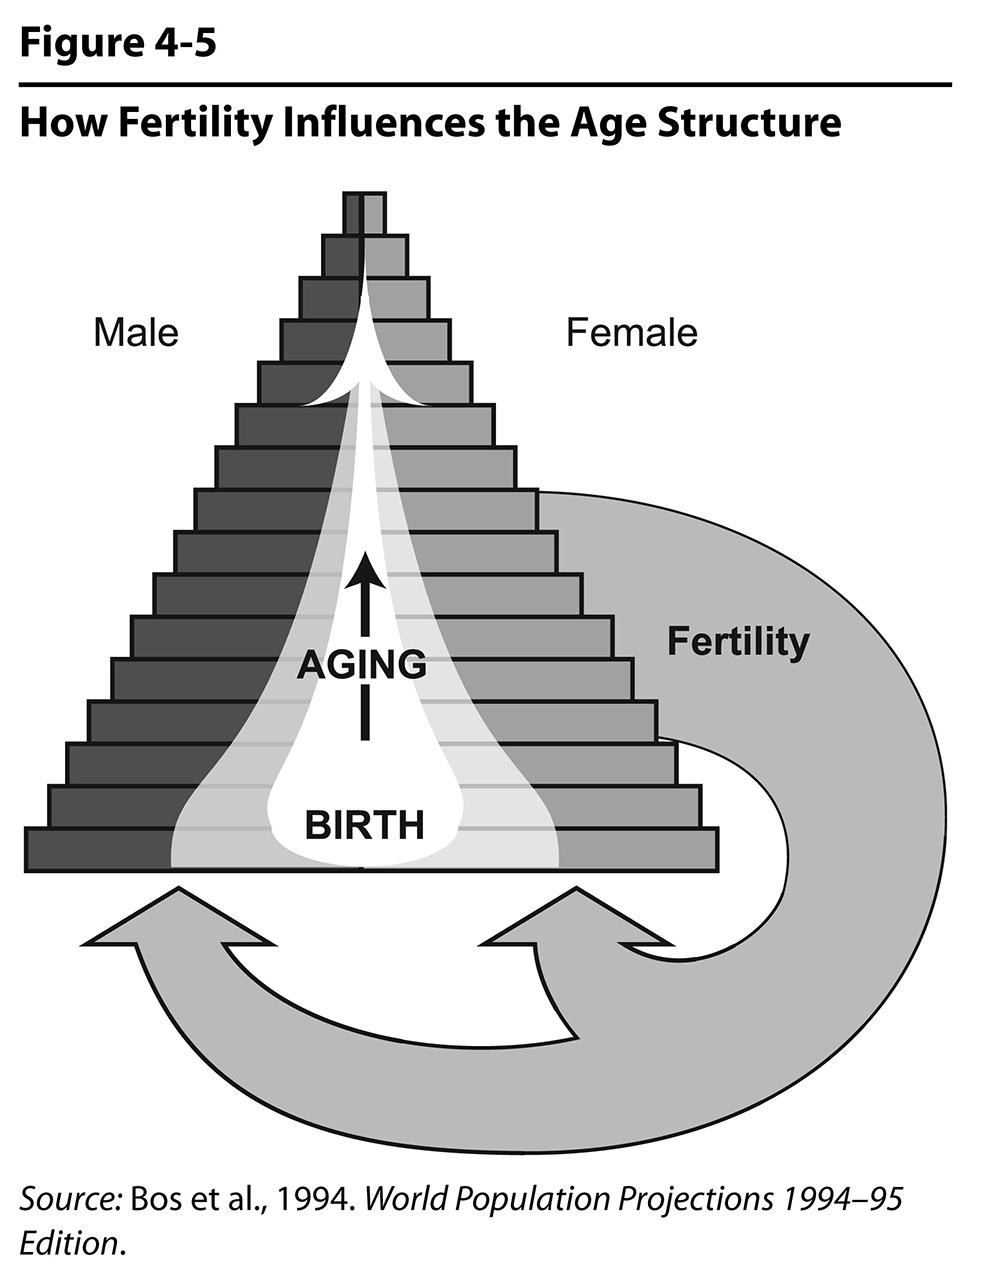
Figure 4.5
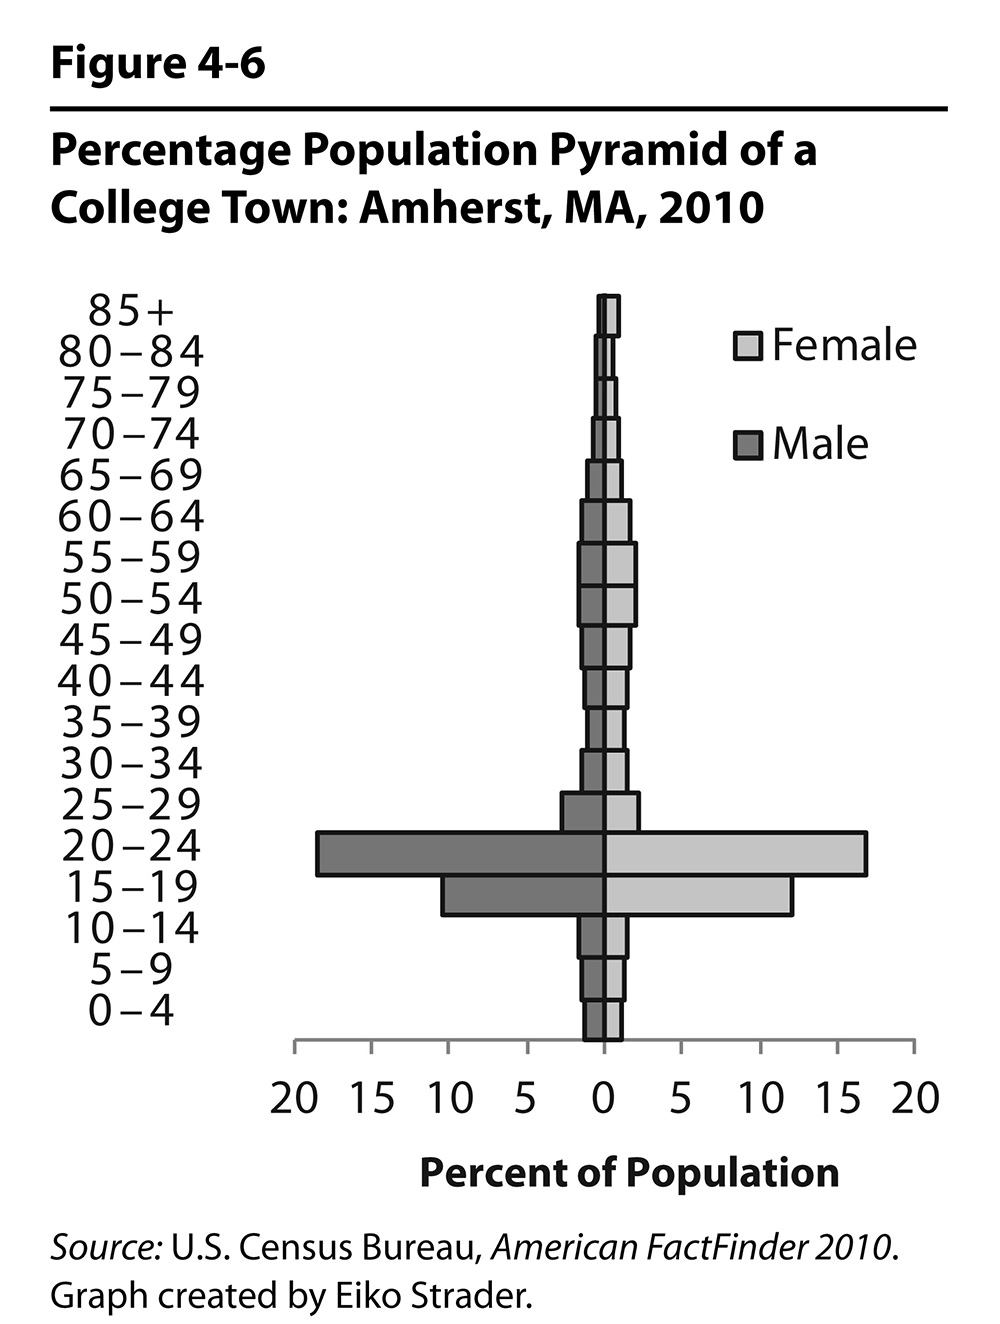
Figure 4.6
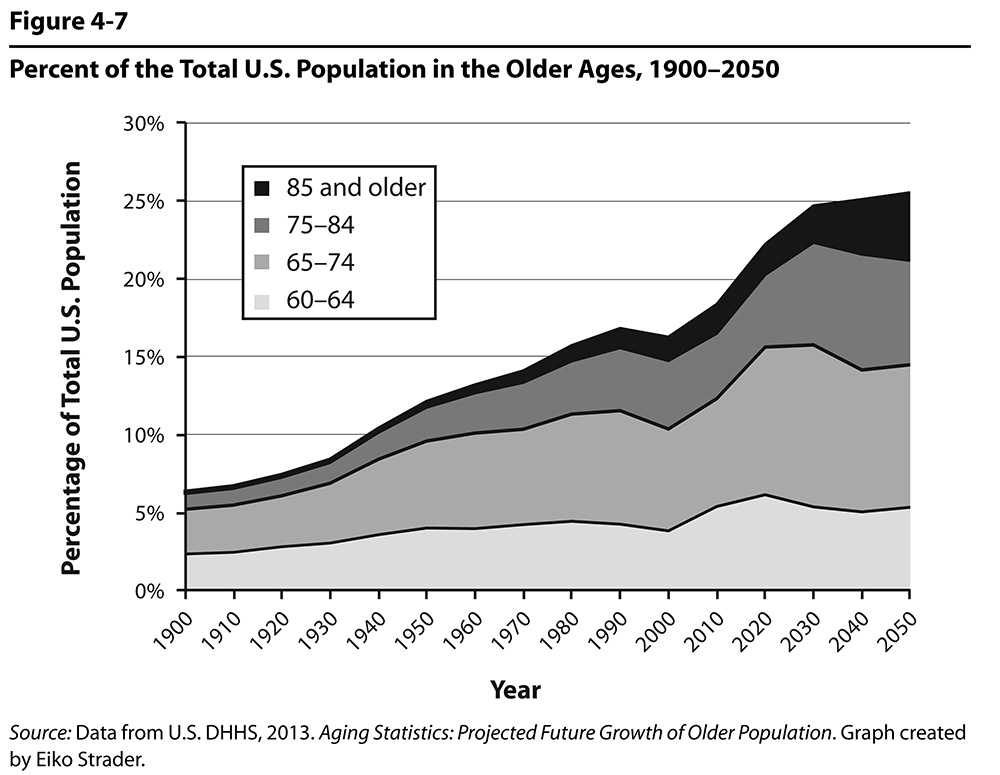
Figure 4.7
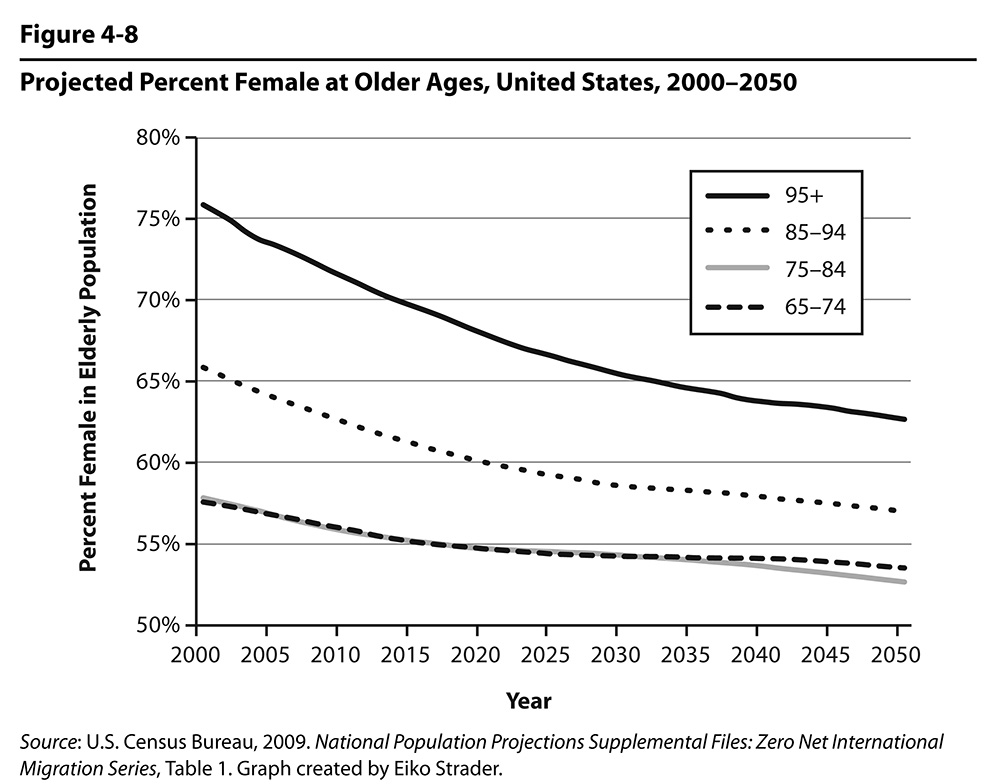
Figure 4.8
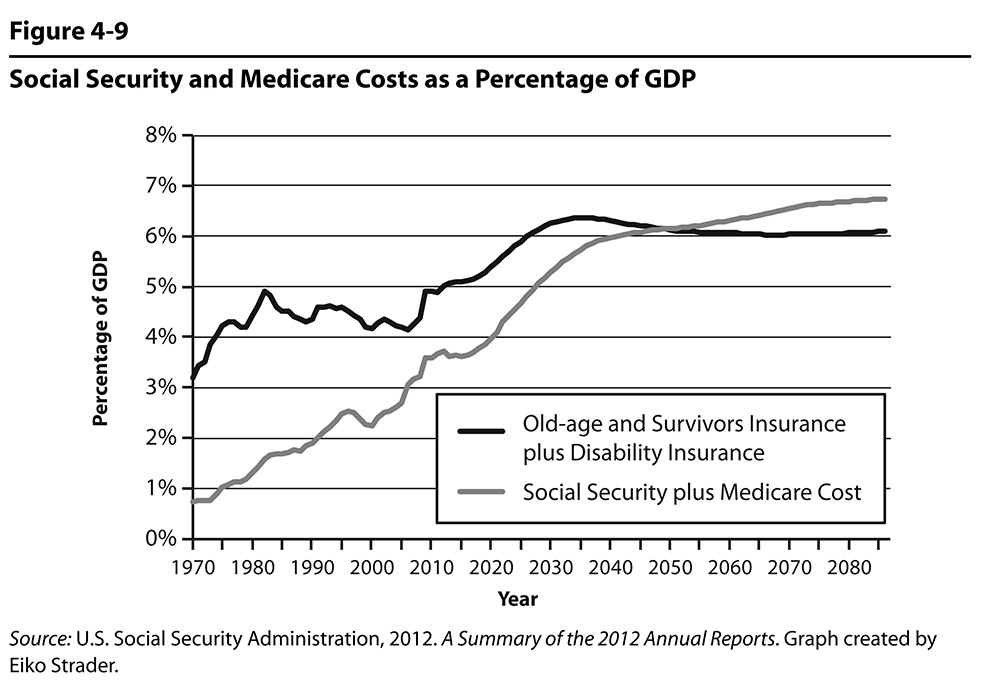
Figure 4.9
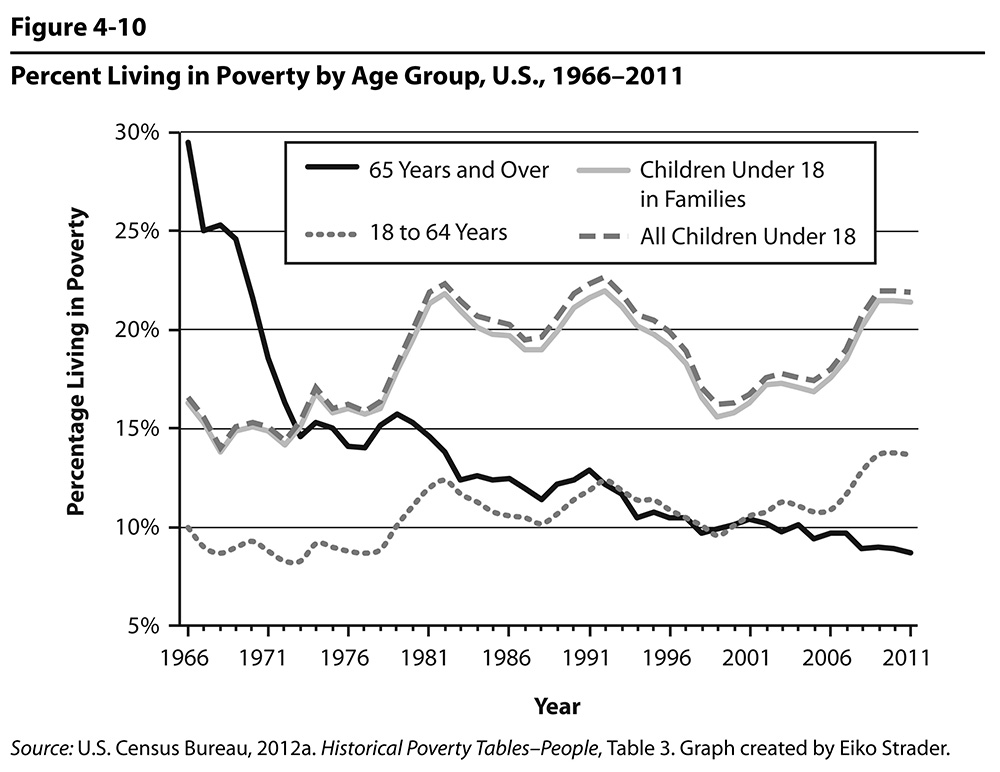
Figure 4.10