Chapter 1: Introduction
Exercise 1
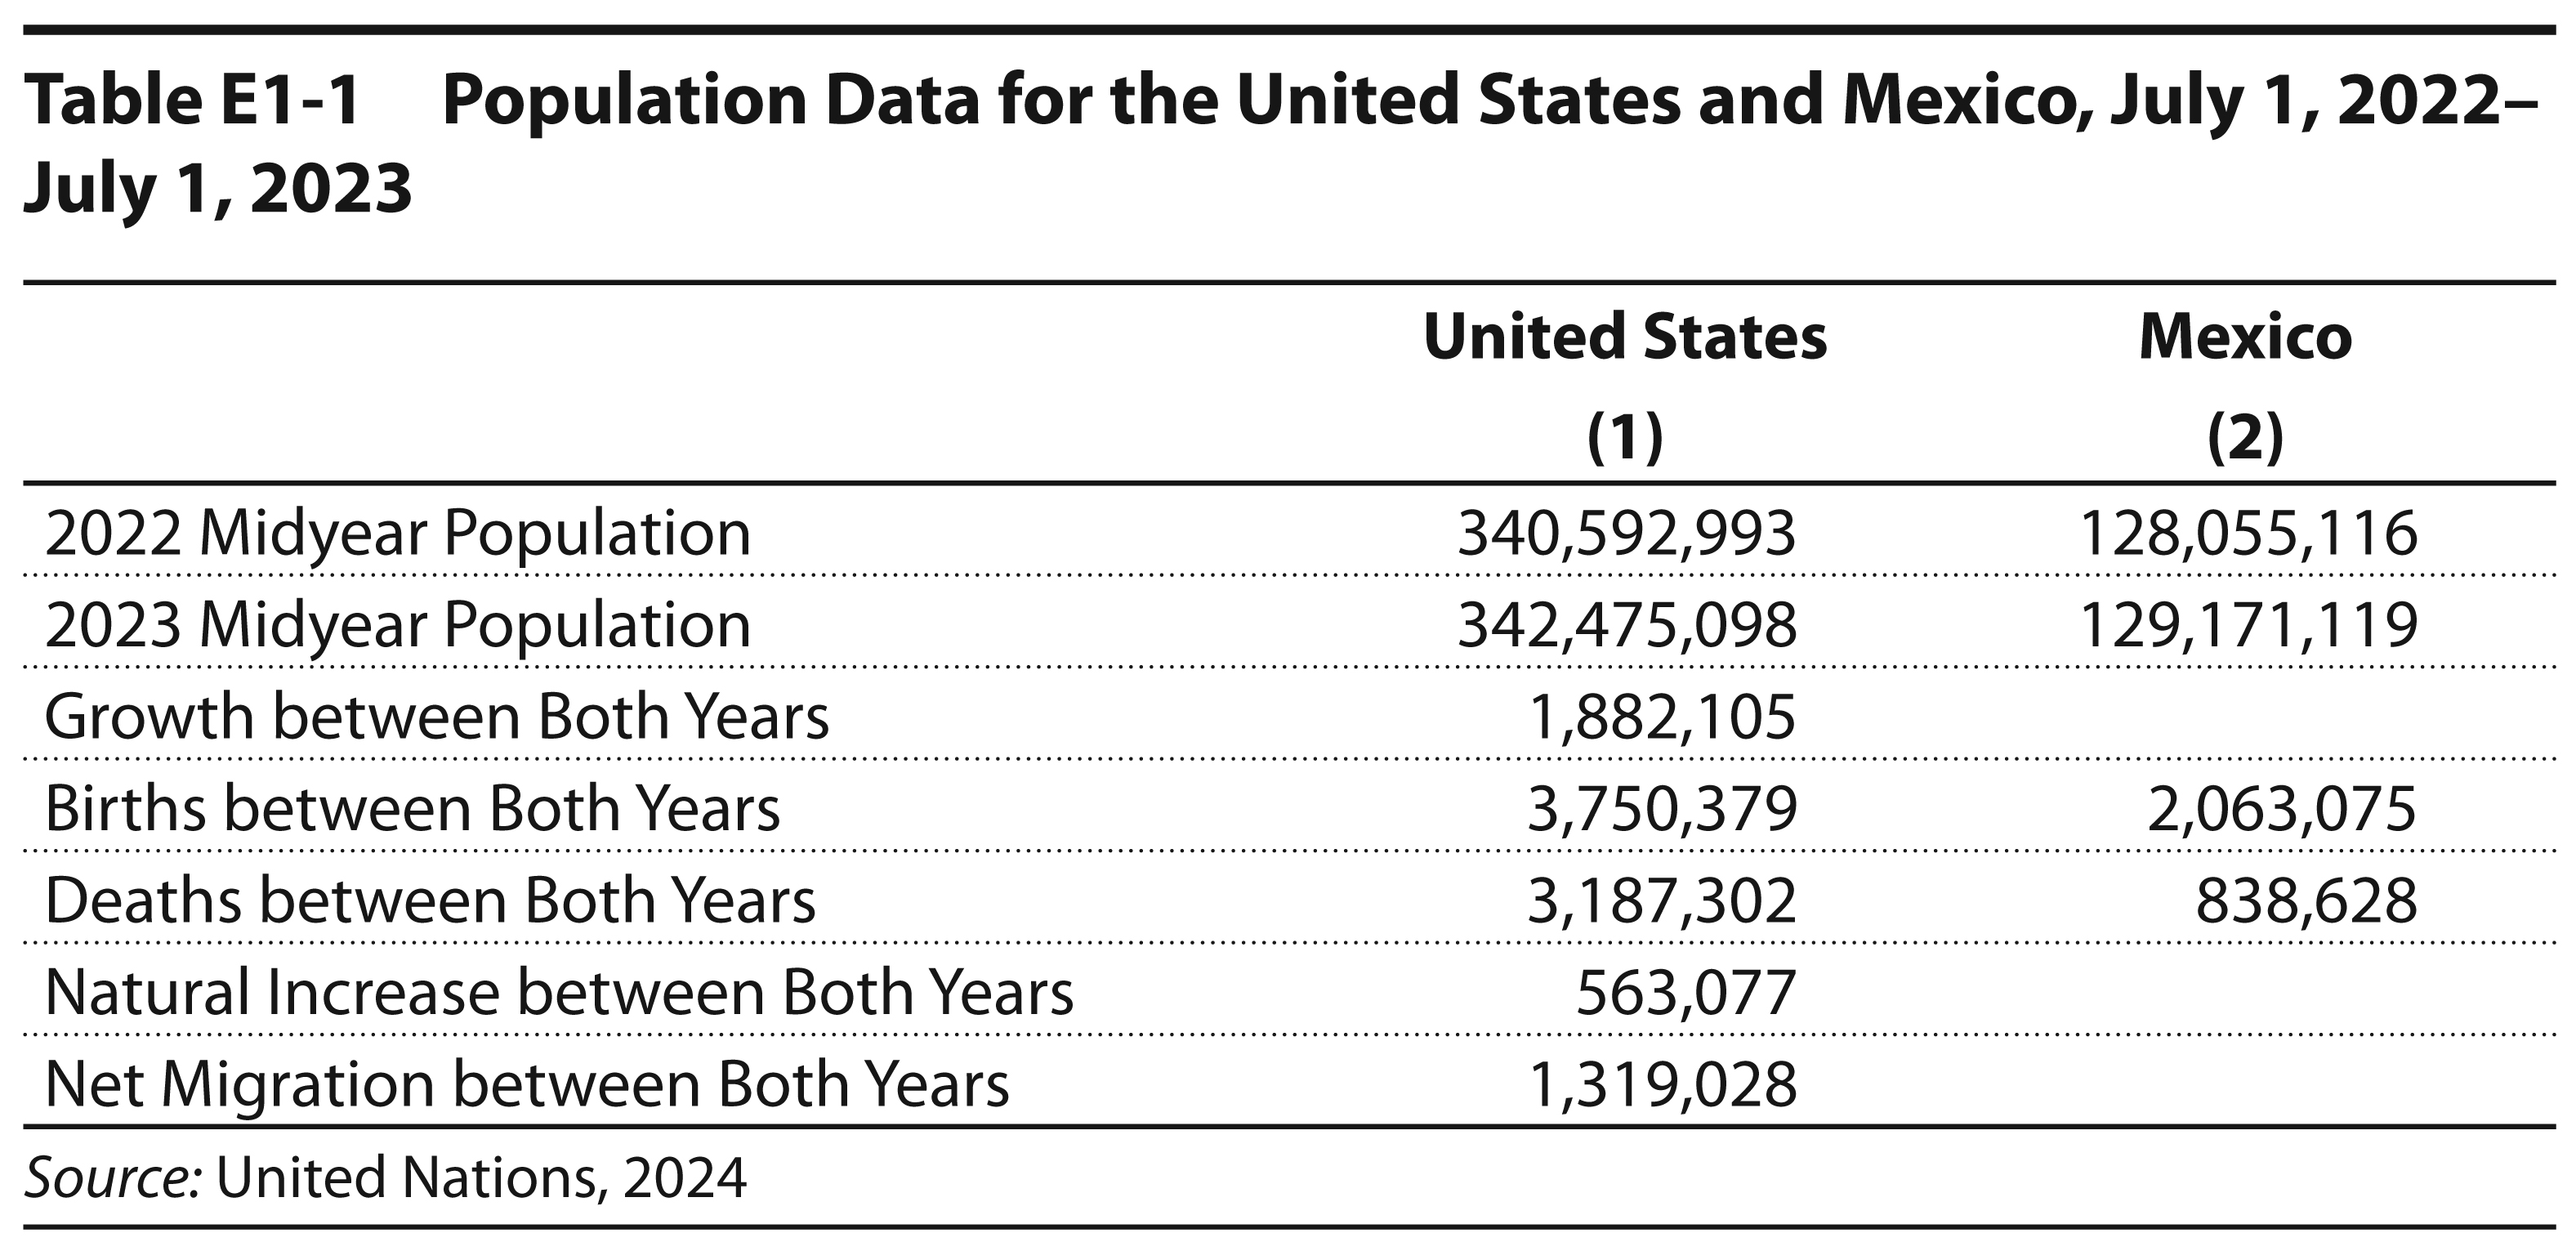
Table E1-1 gives estimated midyear demographic data for the United States and Mexico for the calendar years 2022–2023. Use these data to calculate the estimated net migration for Mexico. Use the blank cells in the table for recording your computations and use the United States column as an example. Remember, the formula needed for these calculations is the growth equation for an open population:
P2 – P1 = B(1,2) – D(1,2) + M(1,2)
Exercise 2
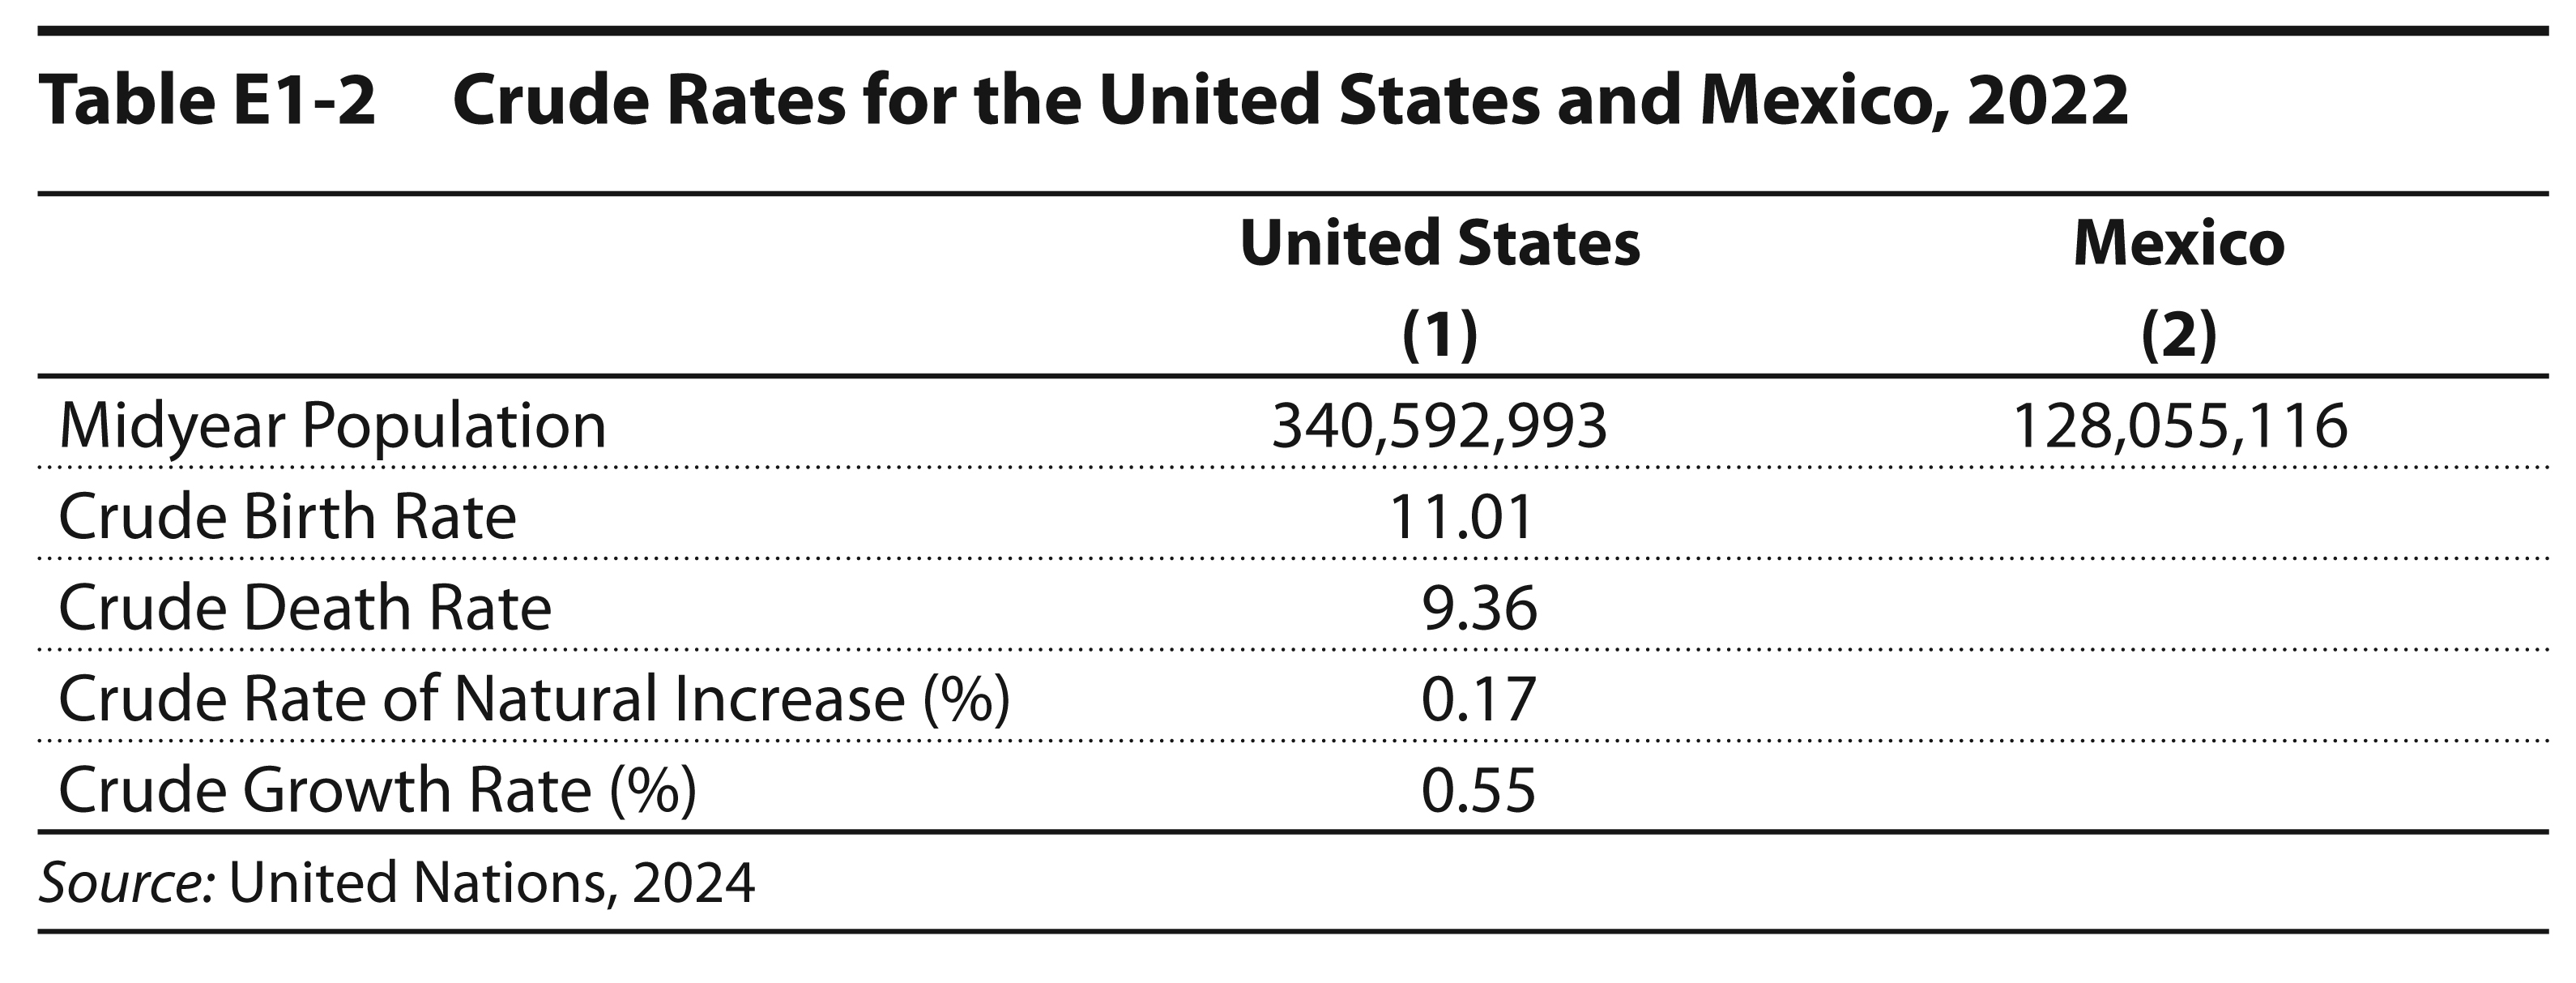
Compute the estimated crude rates for Mexico in Table E1-2. Use the data from Table E1-1 to compute these rates, and the United States column of Table E1-2 as a model. The formula to use for the first two is:
The formula to use for the second two is:
Demographers generally use 1,000 for births and deaths because those events are relatively rare per person and per 1,000 gives readable numbers, e.g. “for every 1,000 people there are X births.” Demographers tend to use a percent (100) for natural increase and growth because those measures are usually communicated as the percent the population changes each year.