Chapter 8: Unions and Householding
Exercise 1. Age Standardization
Suppose you are making a historical contrast between the 1890 and the 2020 U.S. male marital status compositions. You are aware that one reason for a change in marital status composition might be an aging population during the past century (see chapter 4), as opposed to other changes like life expectancy increases and household norms. You might want to know how much of the marital status change is attributable to changes to age structure. Thus, you would want to standardize 1890 to the 2020 age distribution using the direct method below in order to compare the two population time periods.
First, record different information about the two dates in a standardization table, such as Table E8-1. The number of men in each age category (excluding those fourteen and under) for the standard population of 2020 are recorded in column 1 of the top panel in Table E8-1. For the 1890 population, record the proportion of each age category that falls into each marital status (see columns 2, 3, 4, and 5 of the top panel of Table E8-1).
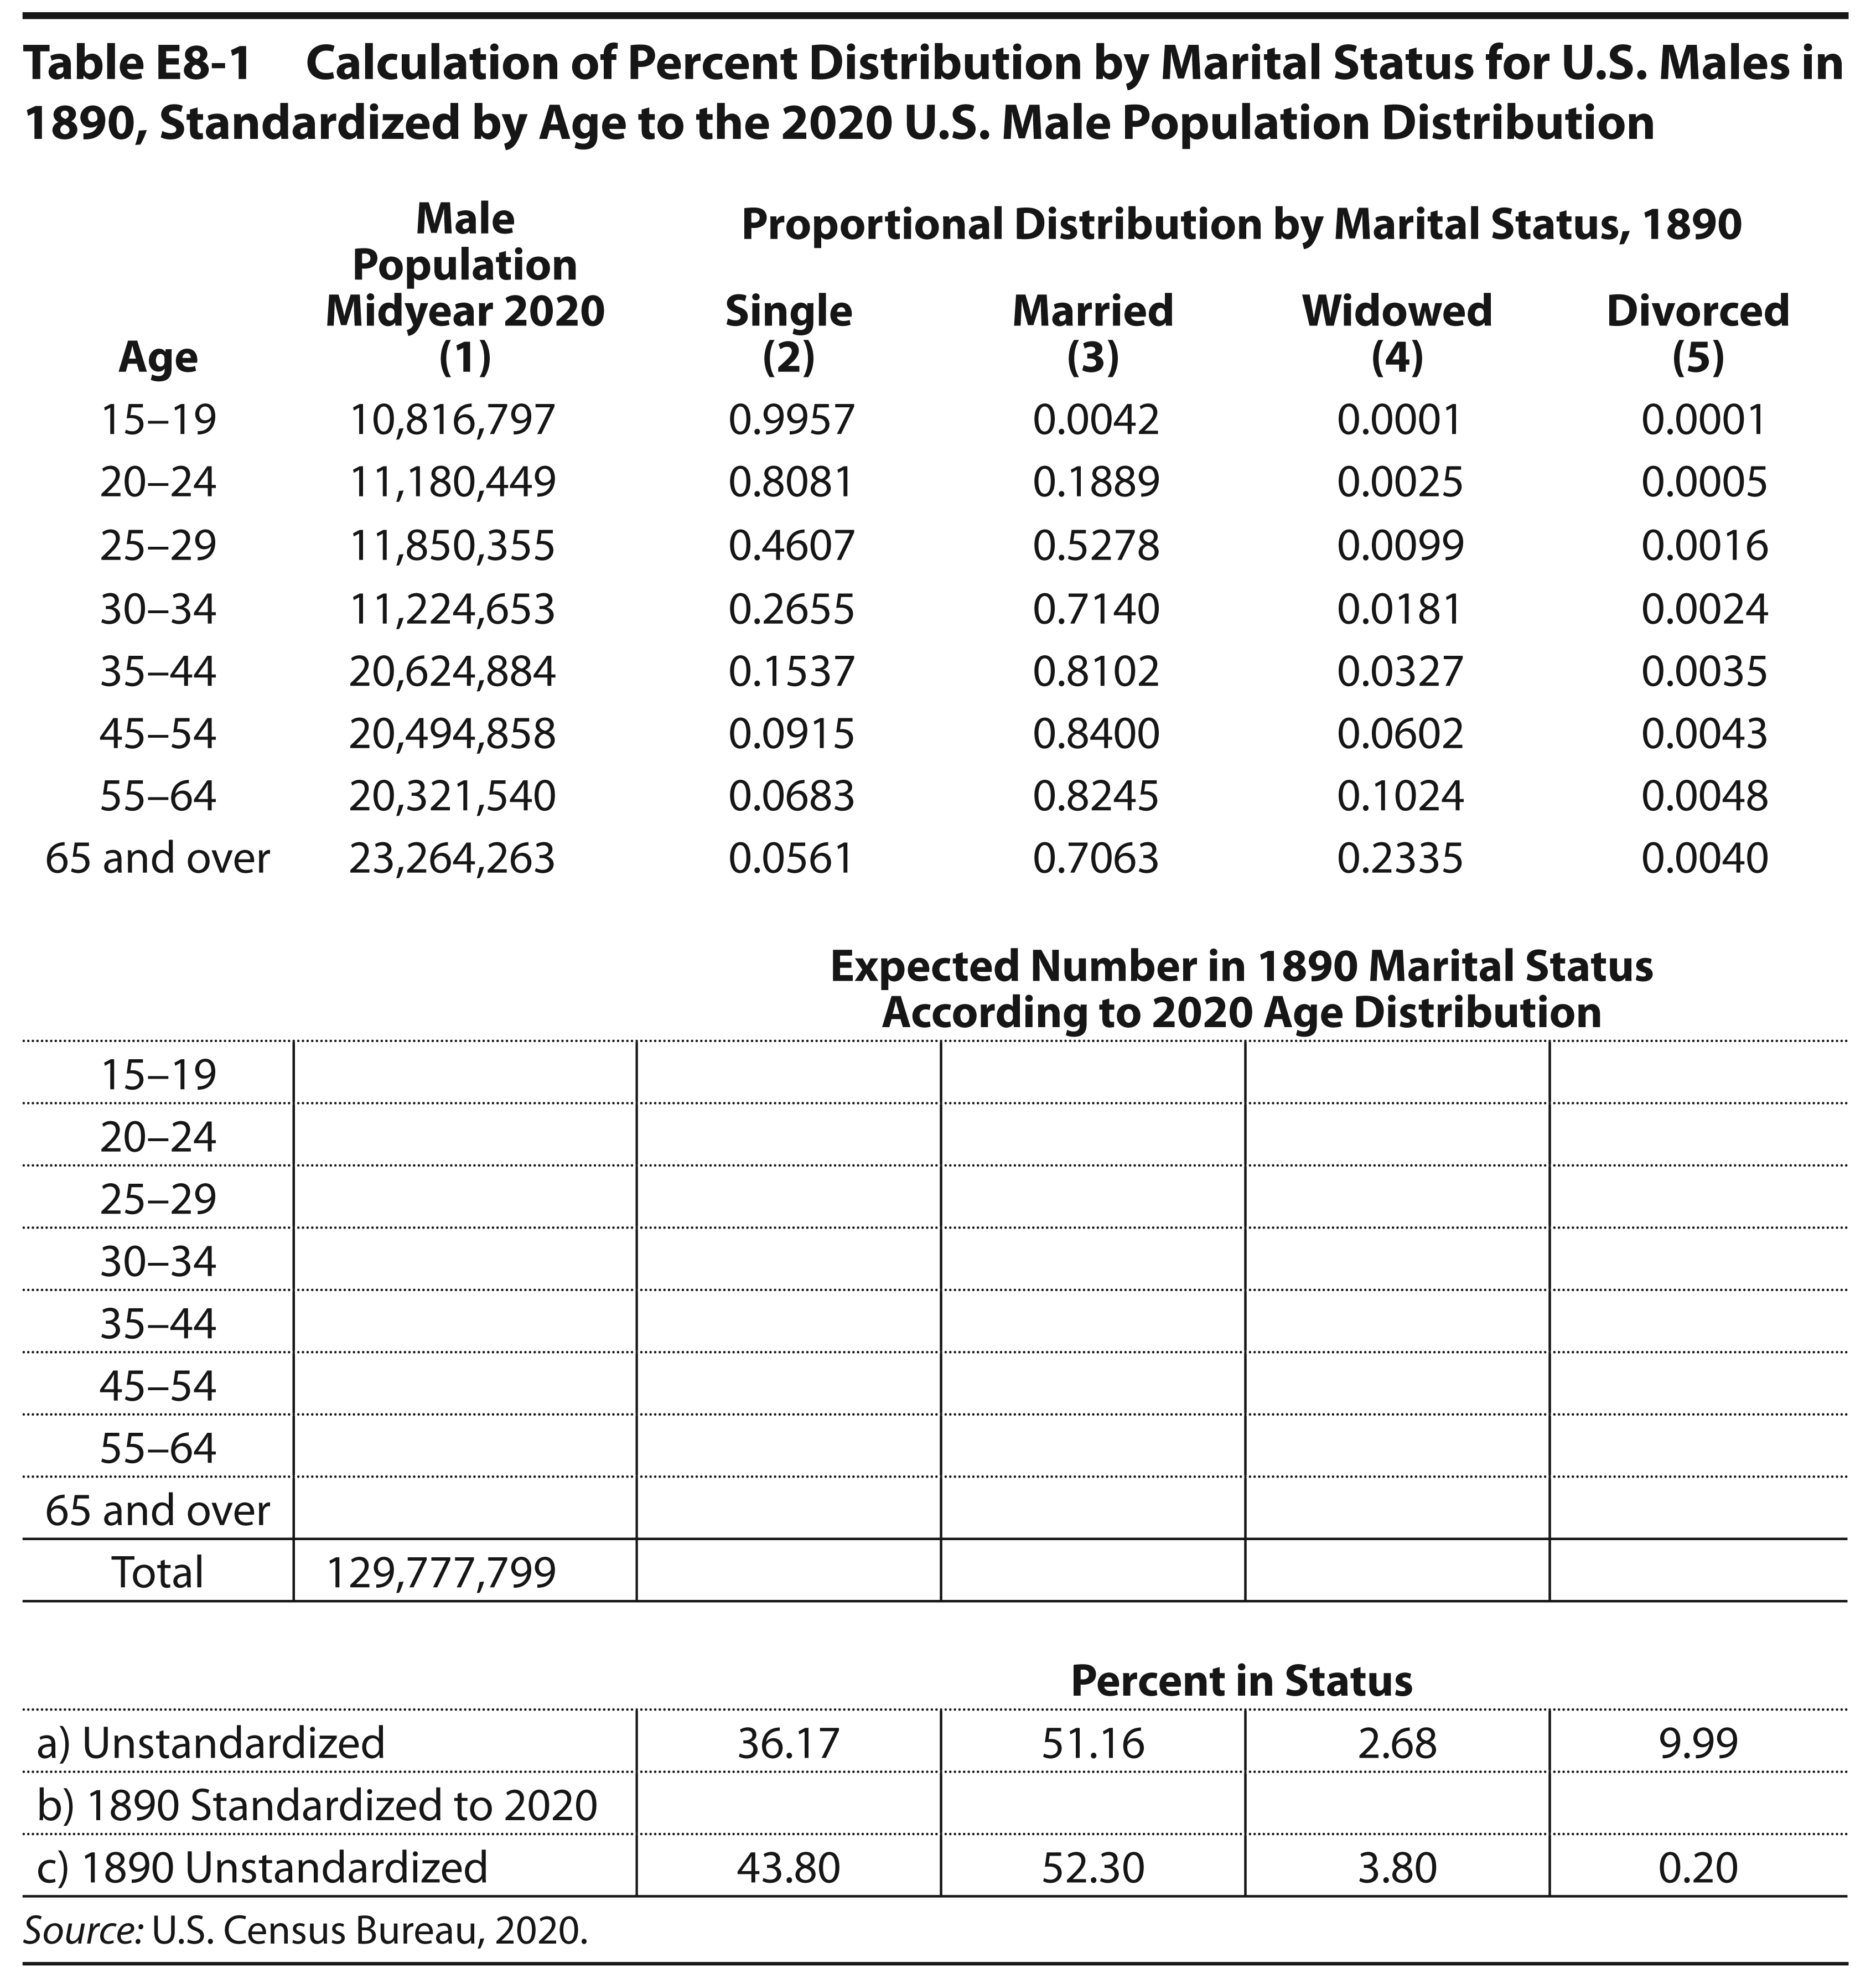
Using these source data, make the following computations, filling in the blanks in the exercise table.
- What features of the 2020 age structure suggest a population with much longer life expectancy than the United States of 1890?
- What does this tell you about the danger of comparing crude marital-status distributions across long historical periods?
Exercise 2. Calculating Annual Rates
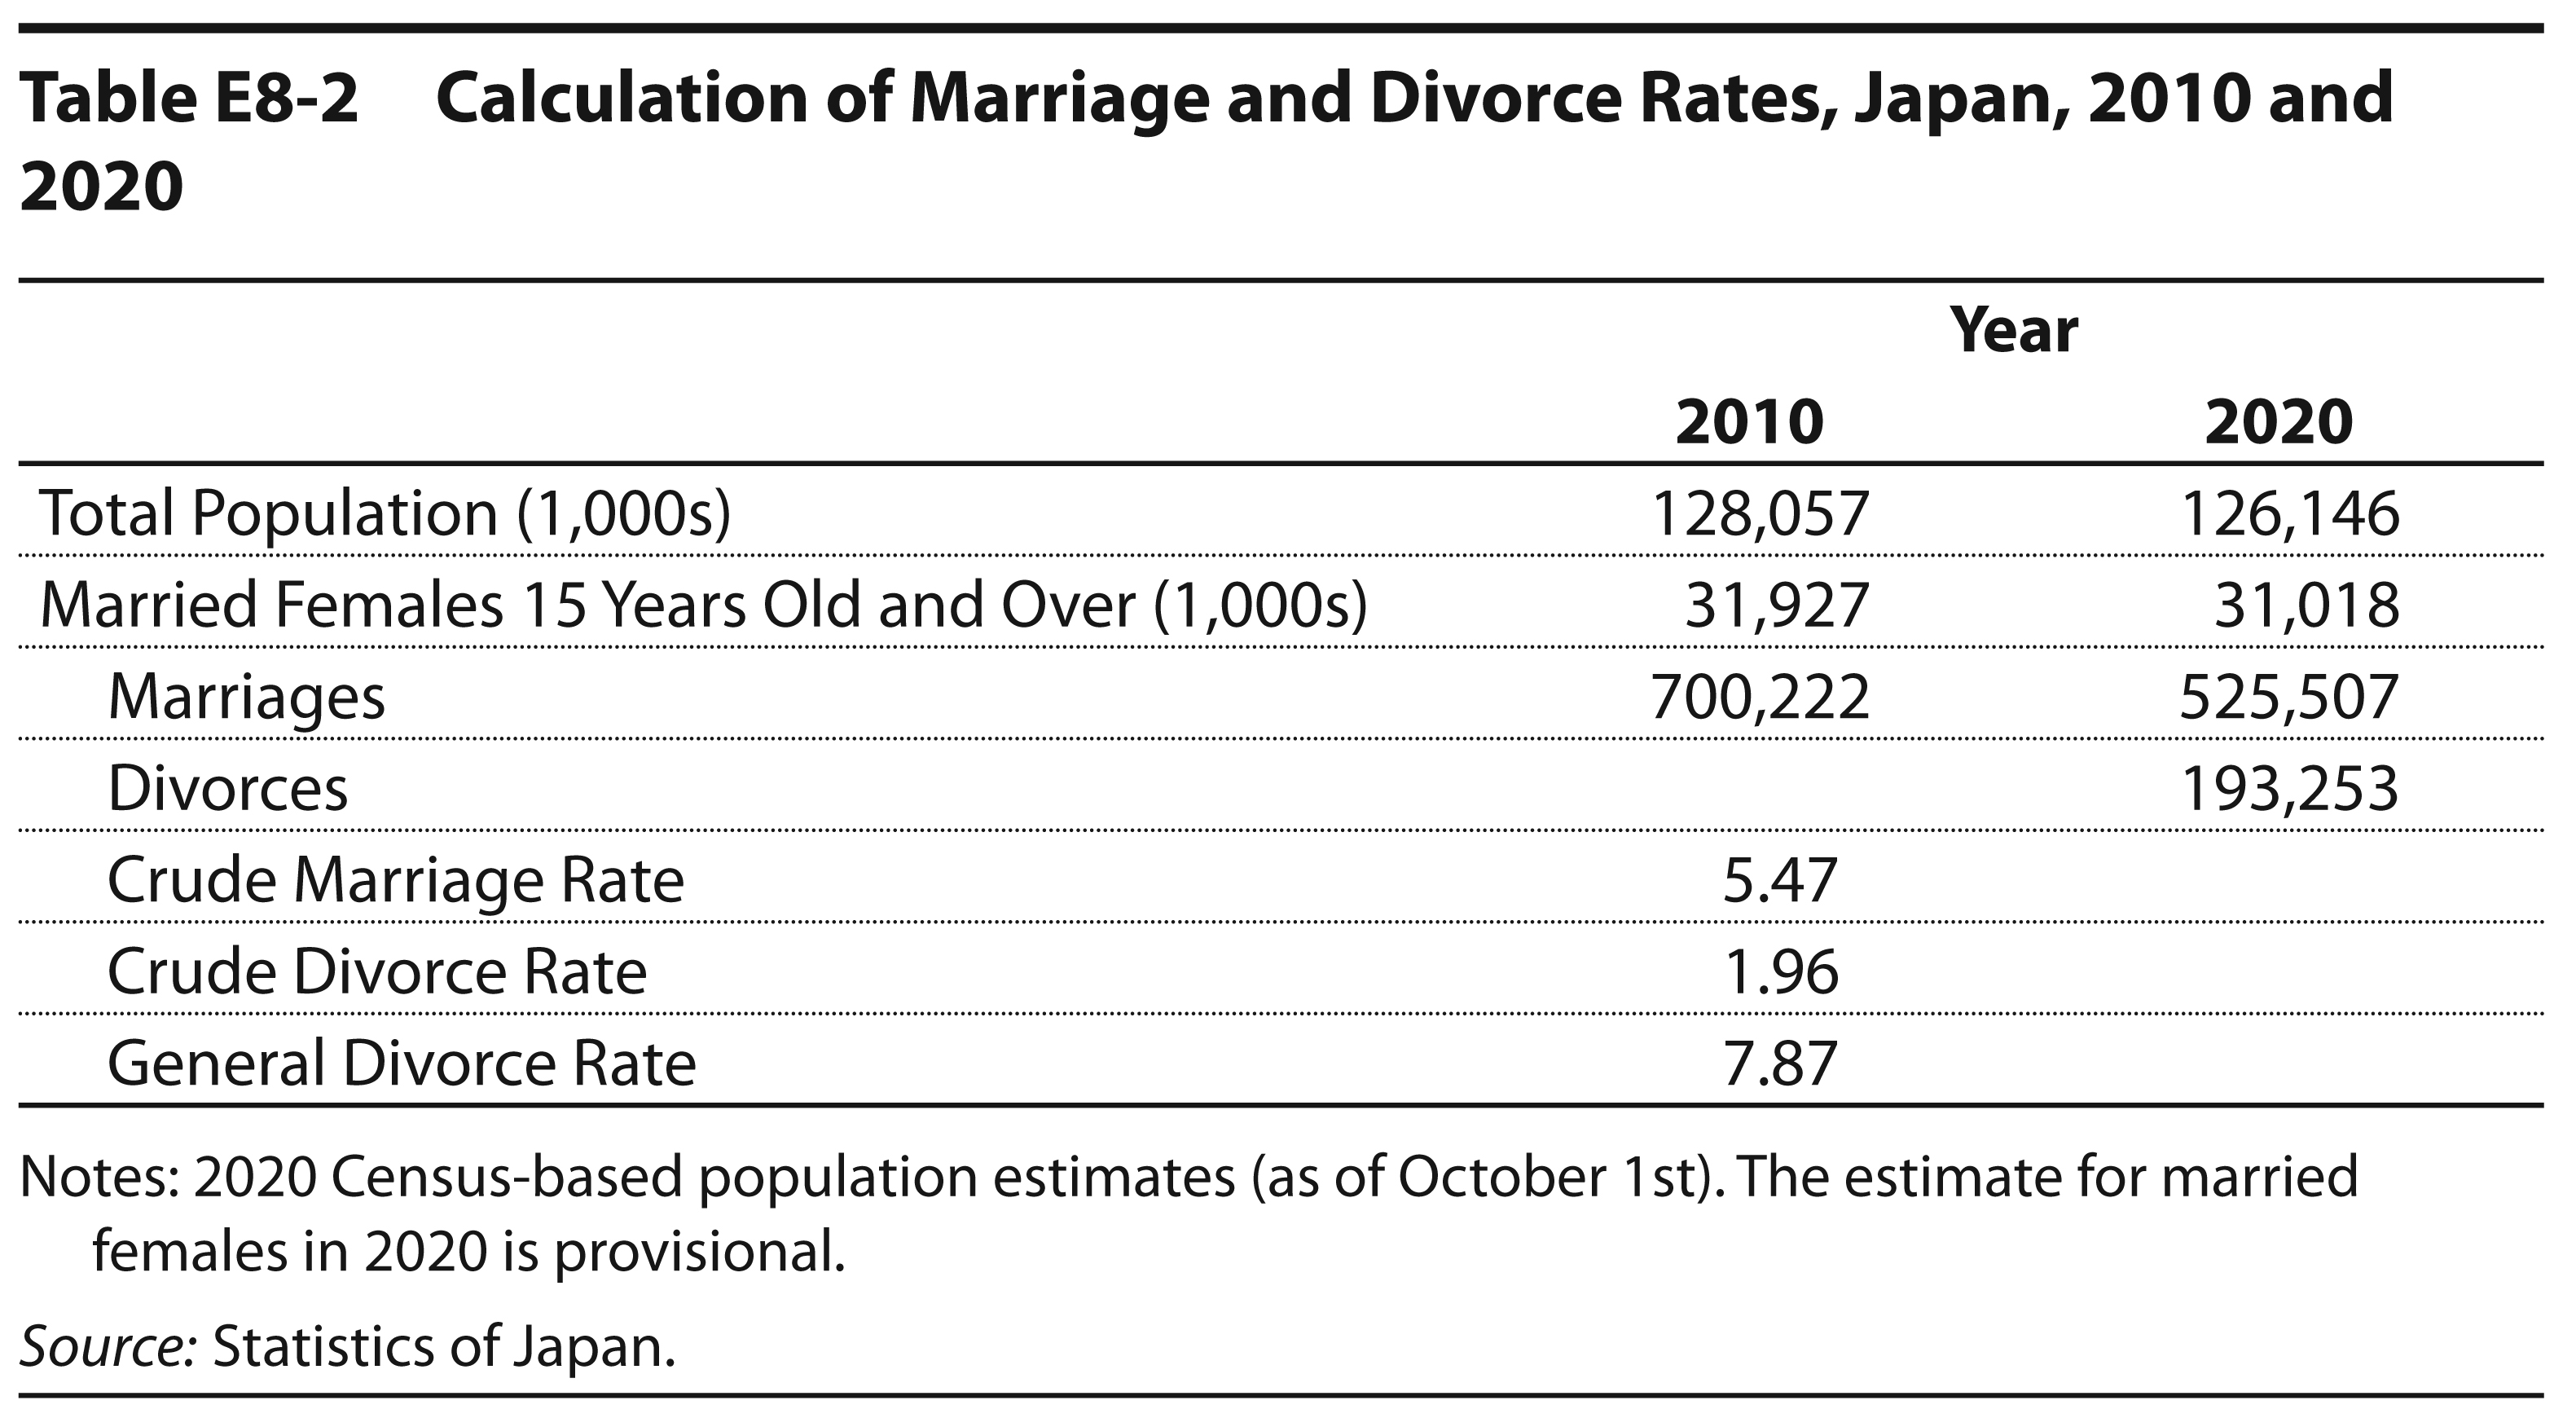
Table E8-2 contains data to compute the Japanese crude marriage and divorce rates (per 1,000 population) and the more refined general divorce rate (per 1,000 married adult women) for the years 2010 and 2020. Complete the table by filling in the blank cells for each rate in 2020 and the number of divorces in 2010.
Exercise 3. Global Changes in Marriage, Divorce, and Households
Go to the Our World in Data page on marriages and divorces at https://ourworldindata.org/marriages-and-divorces. Use the interactive charts on the page to answer the following questions. Record approximate values when exact values are not available.
- Find a country where marriage rates have fallen sharply over time and a country where the decline in marriage began later than in the United States, or where the pattern followed a noticeably different shape. Describe.
- What is your overall takeaway from these marriage-rate patterns across countries?
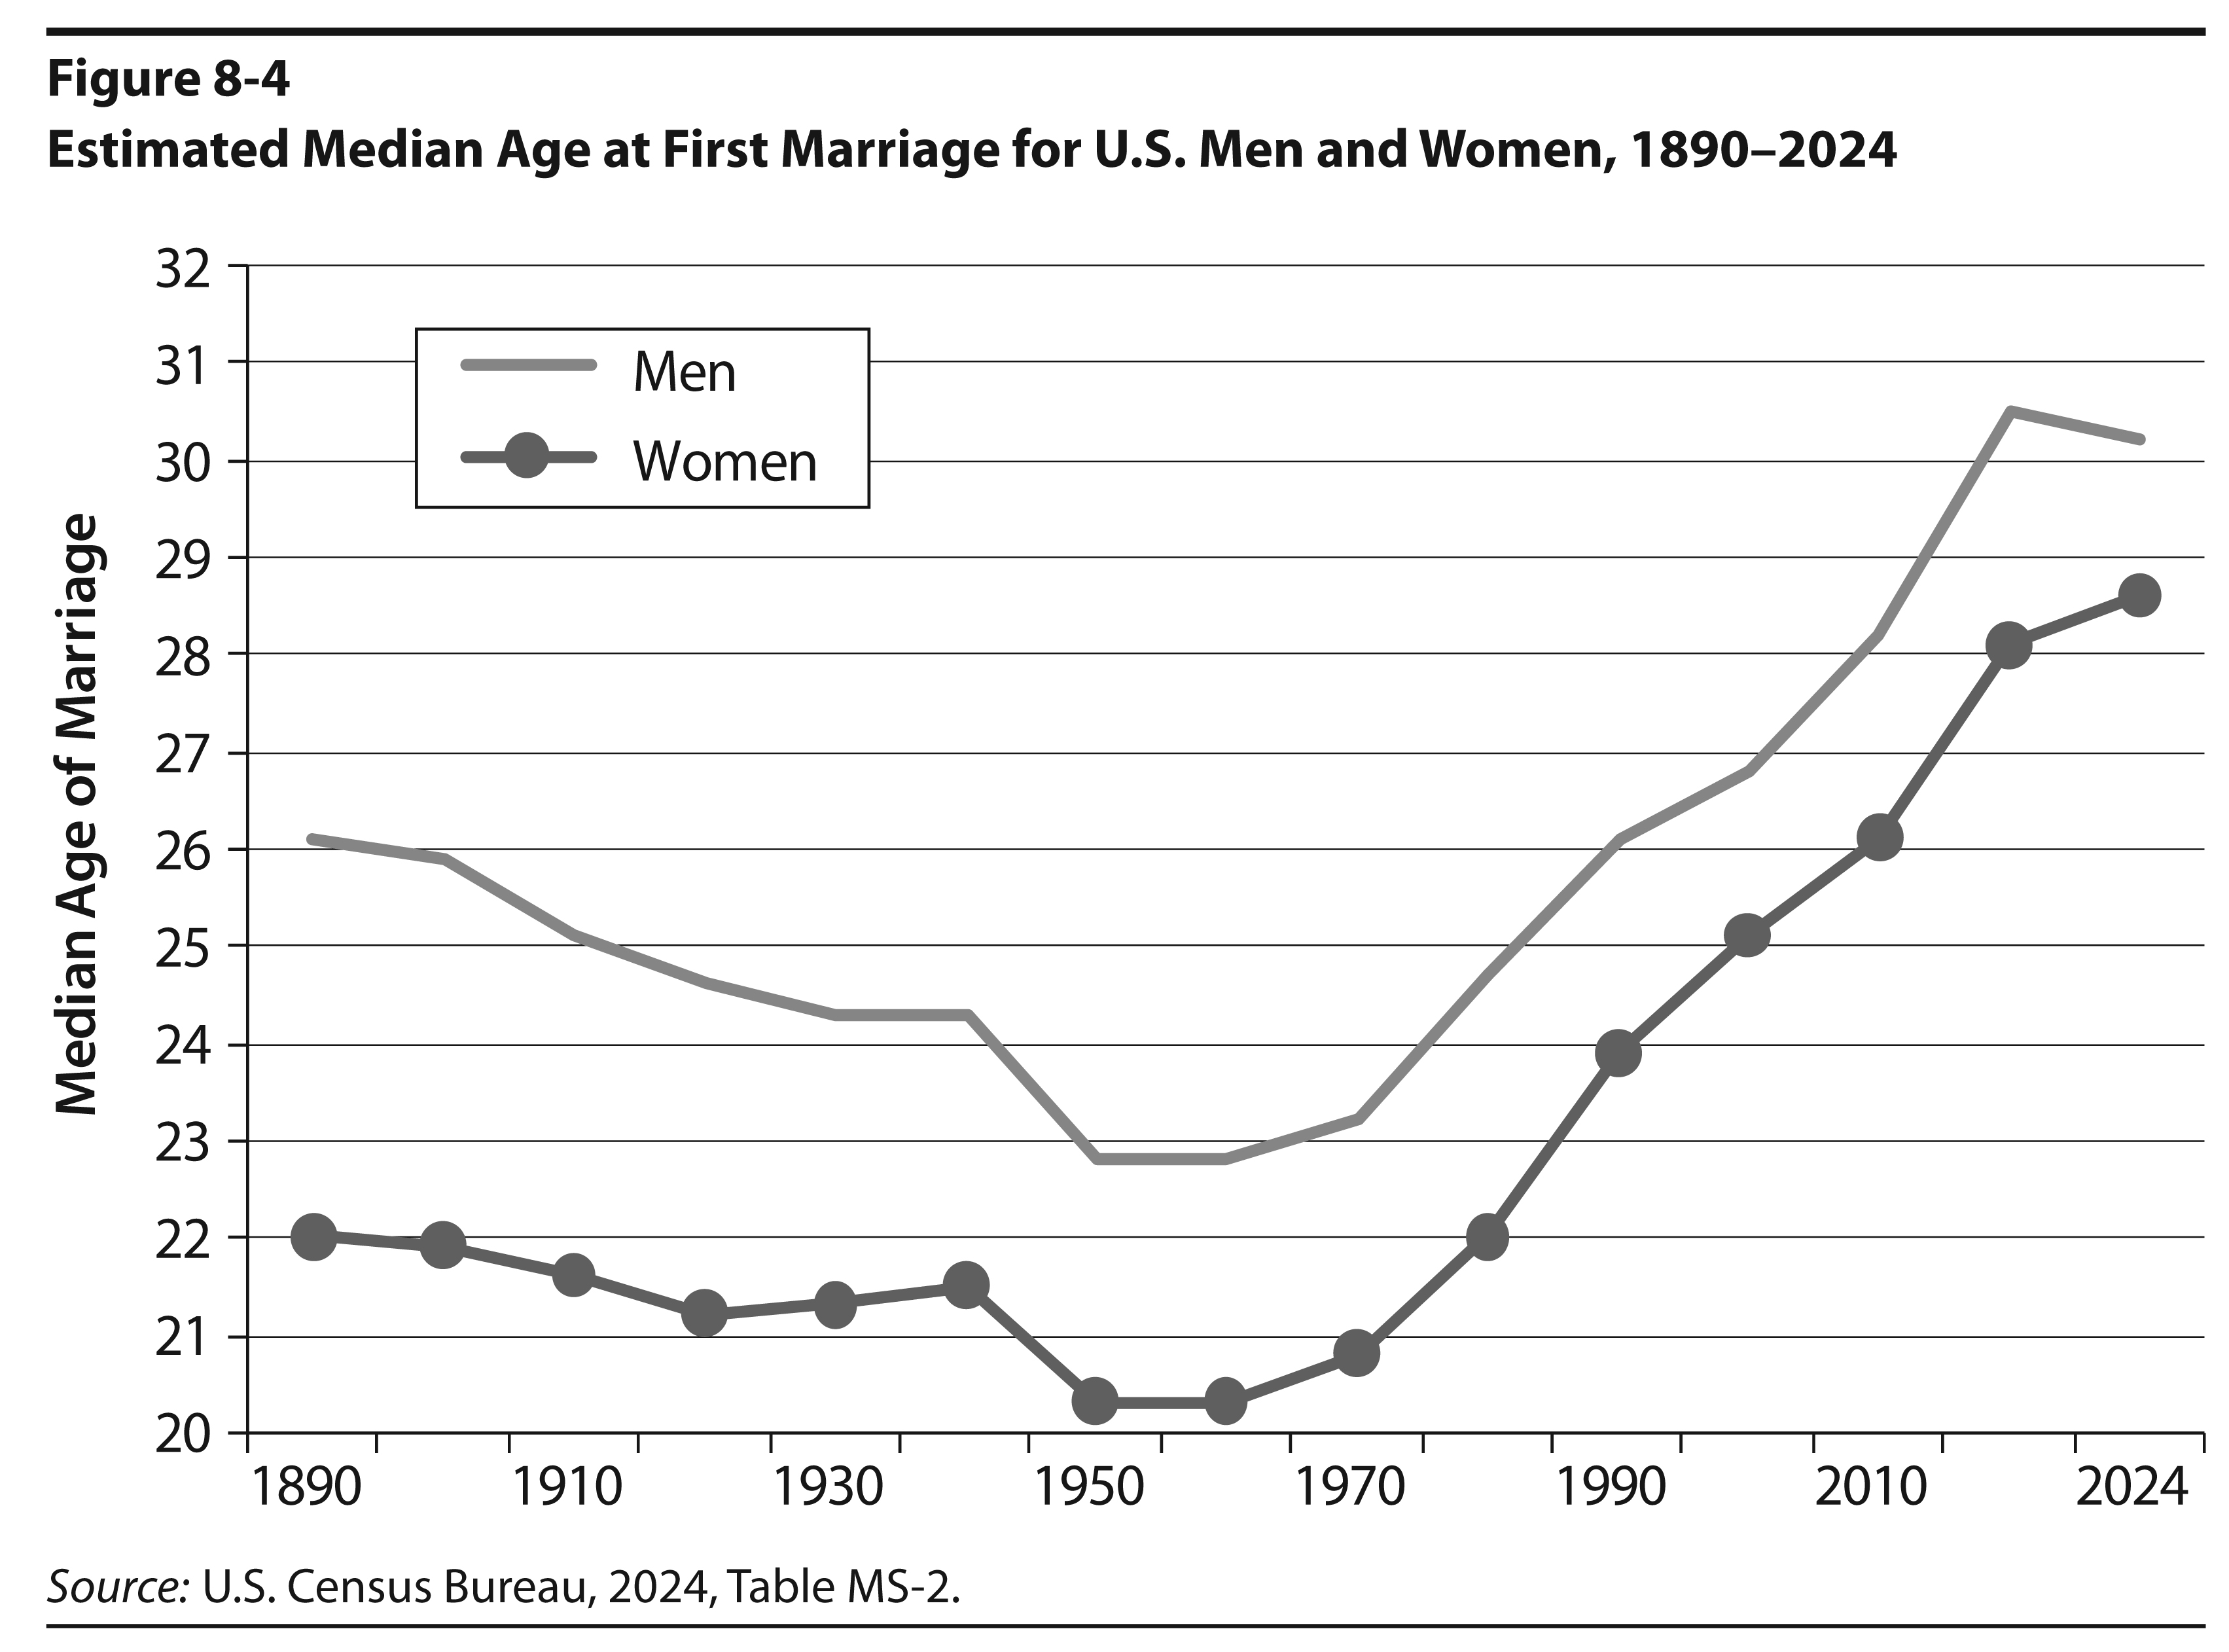
- Find two countries where the average age at first marriage for women has risen substantially over time. In what countries has the average age at first marriage for women moved into the early thirties, or close to it? Find a country where age at first marriage remains relatively lower than in most rich countries.
- What is your overall takeaway about delayed marriage across countries?
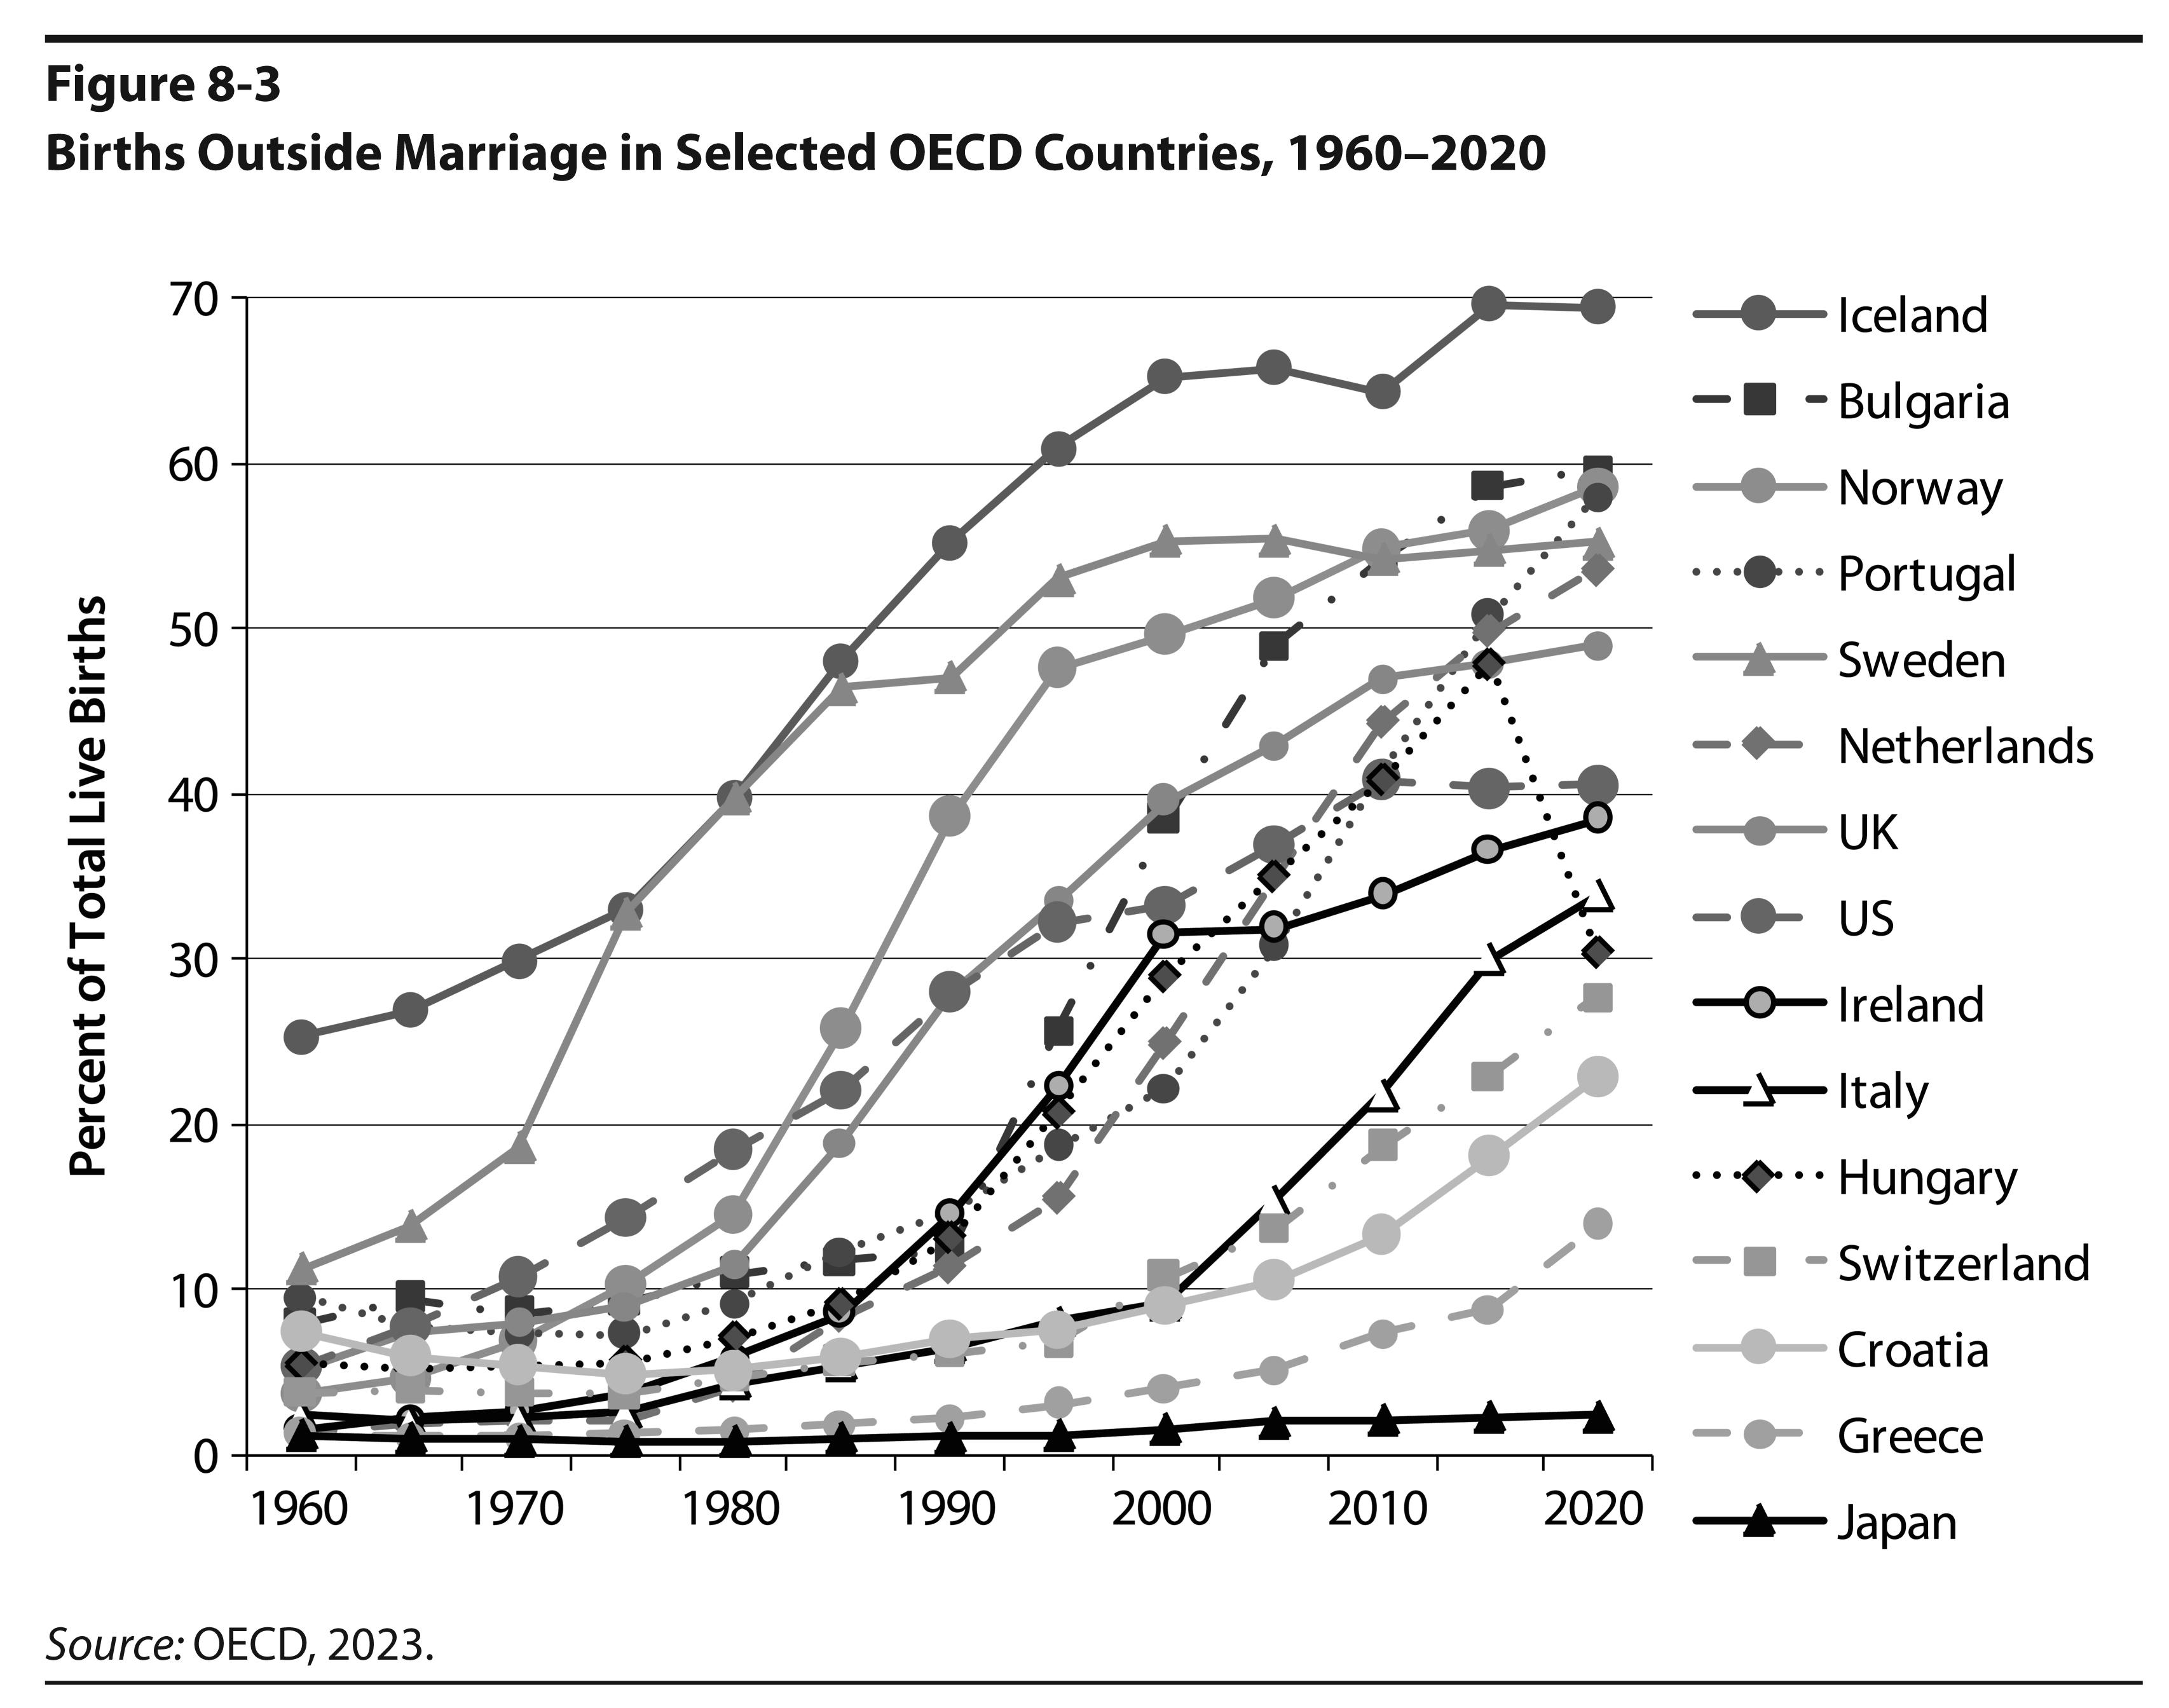
- Find two countries where the share of births outside marriage rose above 50 percent and find a country where births outside marriage have remained unusually low.
- What is your overall takeaway about the relationship between marriage and childbearing?
- Find one country with a high share of single-parent households and one country with a much lower share. Describe the contrast.
- Based on the chart, does single parenting appear to be rising everywhere, or is the pattern mixed across countries? Explain.
- Find the first country to legalize same-sex marriage. Describe when this occurred and how the page distinguishes full marriage equality from partial recognition such as civil unions. Identify a region where legalization spread rapidly after 2000.
- What is your overall takeaway about the pace and geography of change in same-sex marriage rights?
- Find one country where divorce rates more than tripled between the 1970s and 1990s and a country where divorce peaked earlier than in many others.
- What is your overall takeaway about divorce trends across countries?