Crosswalk Header Banner

DEMOGRAPHY

Study of Human Population, Fifth Edition

Chapter 9: Migration

Exercise 1

Table E9-1 is a matrix showing U.S. regions of residence for those who migrated between 2022 and 2023, according to the Census Bureau’s American Community Survey. An interregional migrant is defined as anyone who had a different U.S. region of residence in 2023 than in 2022. All values are in thousands (e.g., 601 = 601,000 people). Answer the following questions:
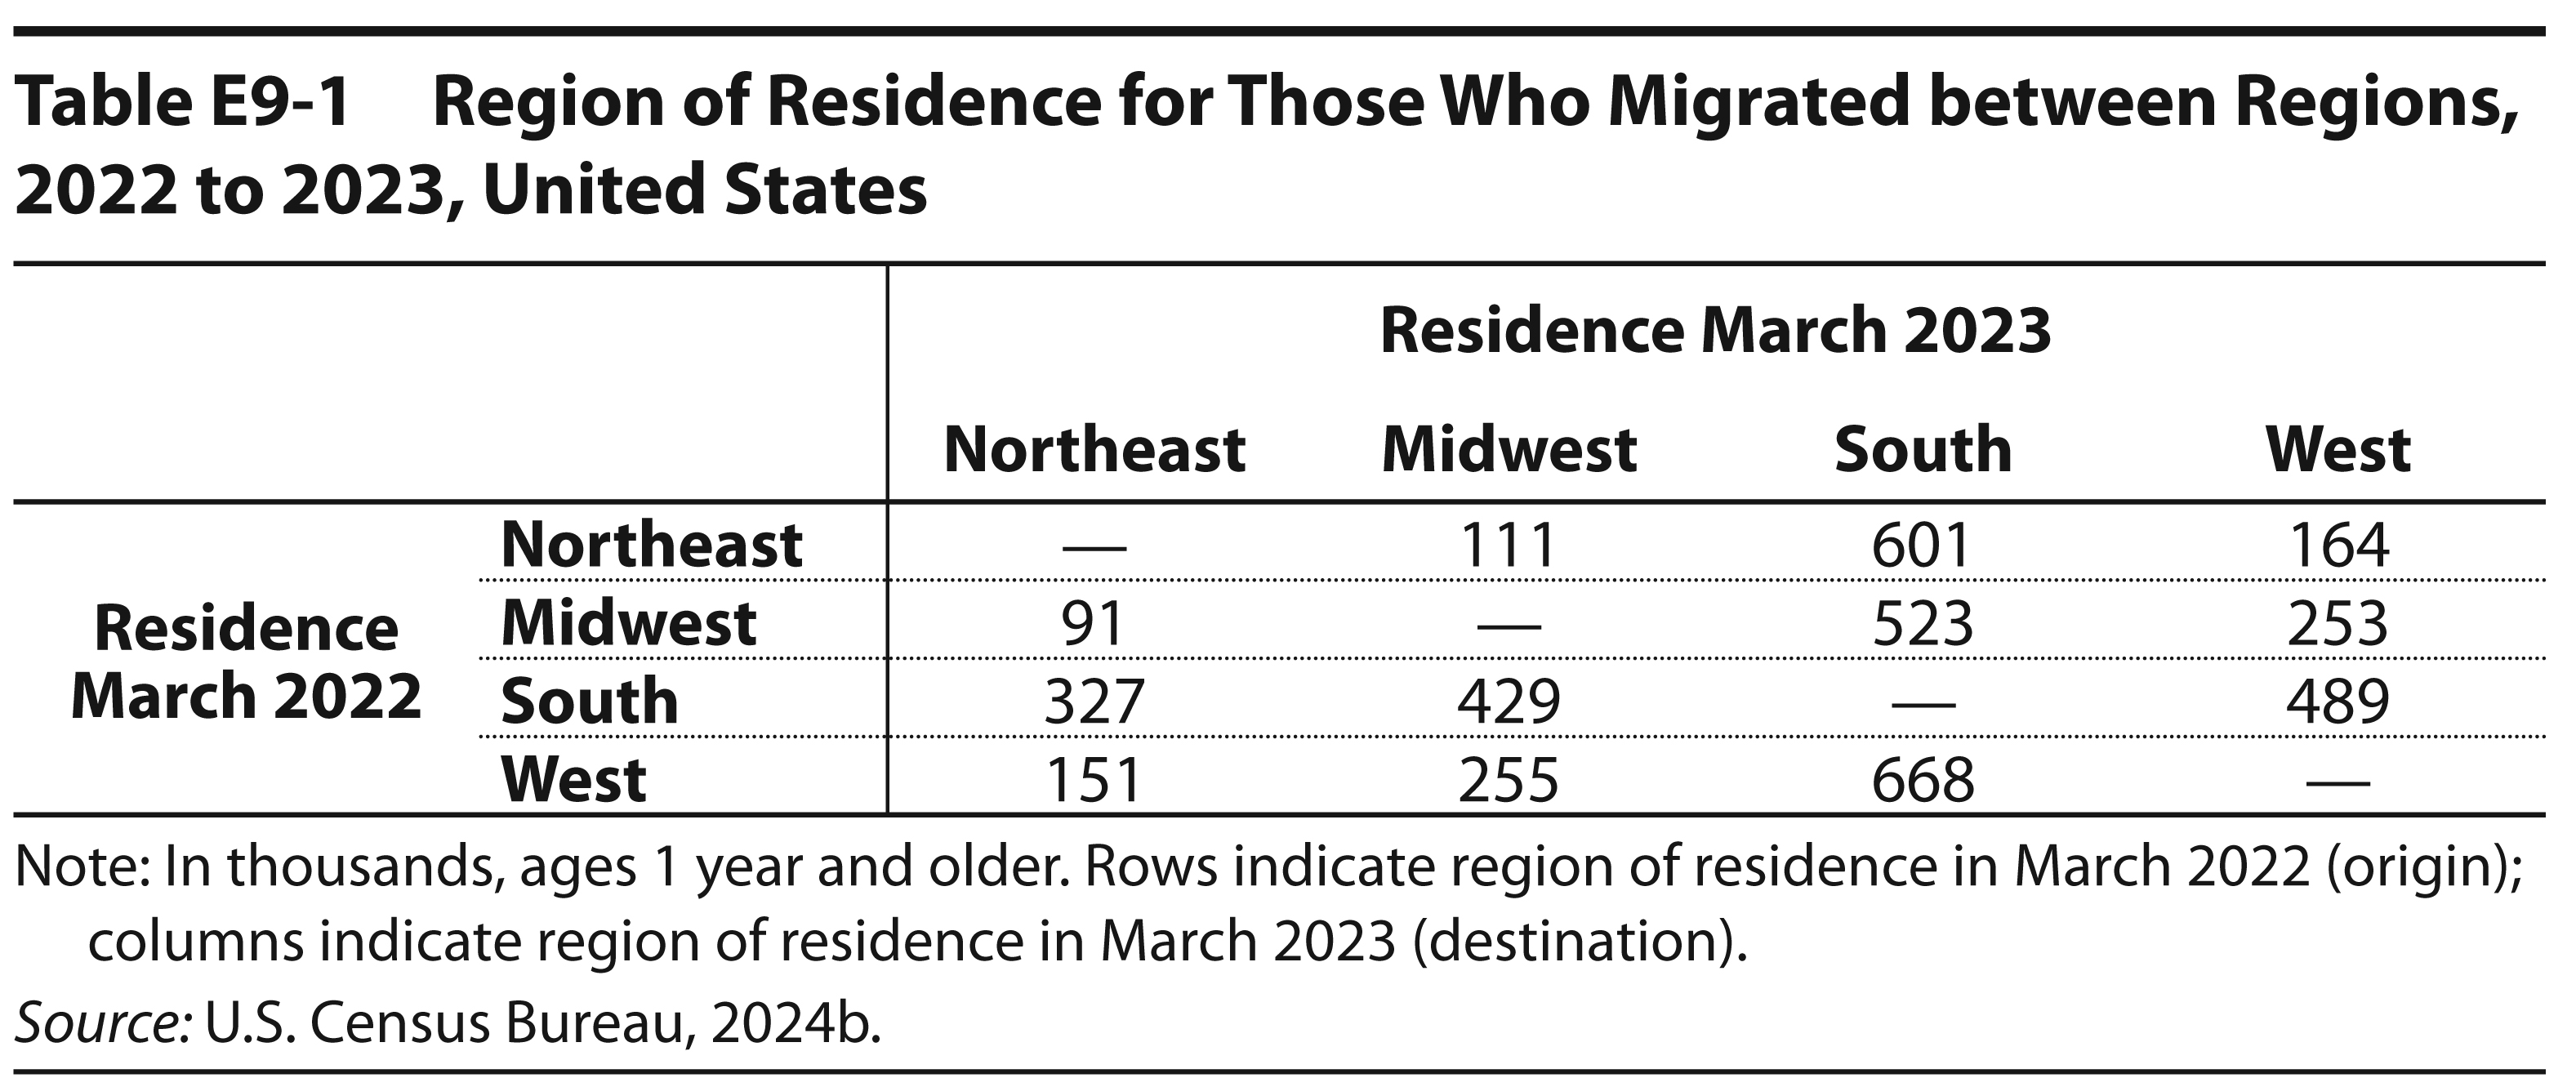
a. The migration stream from the Northeast to the South had 601,000 people. How many were in the migration stream from South to Northeast?
b. The gross migration (or the total volume) between the South and the Northeast was 928,000 people. What was the gross migration between the Midwest and the South?
c. If net migration from the Northeast to the South was +274,000, what is the net migration from the South to the Northeast?
d. What was the net migration from the Midwest to the South?
Table E9.1

Exercise 2

Suppose you had the hypothetical interregional migration situation in Table E9-2. Columns 1 and 2 show the 2020 resident male and female populations in areas A and B, column 3 shows migration from Area A to B and column 4 shows migration from Area B to A. All values are in thousands (e.g., 300 = 300,000 people). Note that Ratio (× 100) = number of males per 100 females.

a. What is the net migration to Area B (from Area A), calculated as migrants from A to B minus migrants from B to A?
    of men _________
    of women _______
b. What would be the influence of this sex-selective net migration on the male-to-female sex ratio of the new resident population of Area A? (Check one.)
    _______ raise it     _______ lower it     _______ no influence
c. The influence would be in the opposite direction in Area B, but would the degree of effect be more, or less, in Area B, given that Area B has a larger initial population? (Check one.)
    _______ more     _______ less     _______ the same
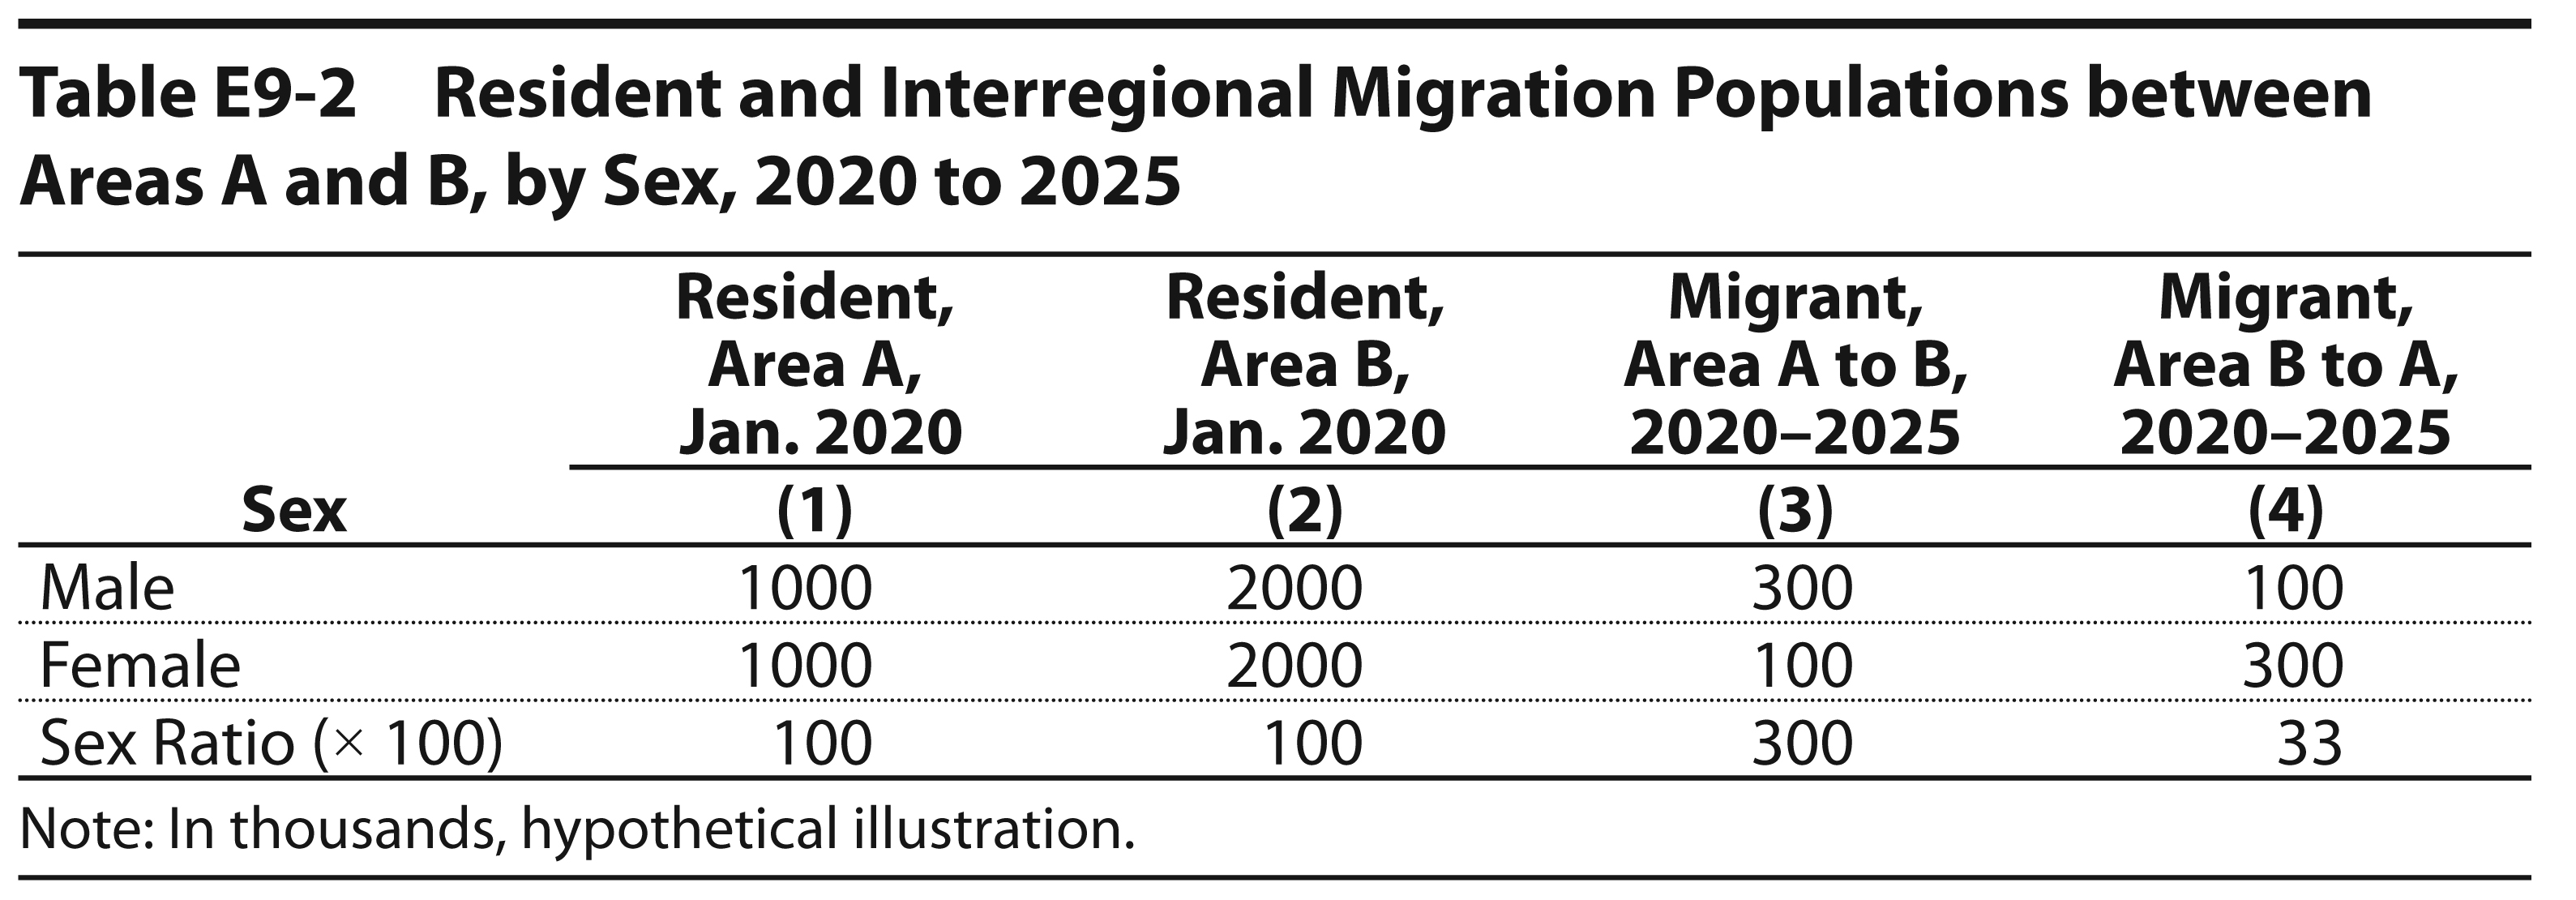
Table E9.2

Exercise 3

Lacking direct counts of migration, nations often infer net migration between censuses by the vital statistics method. The appropriate formula is:

M
=
(P₂ – P₁) – (B – D)

You may recognize this as a transformation of the growth equation presented in chapter 1. Table E9-3 shows the required calculations of net migration for the United States from 2022 to 2023. Following that model, estimate the net migration for Mexico from 2022 to 2023. Enter your answers in the blank spaces in the table.
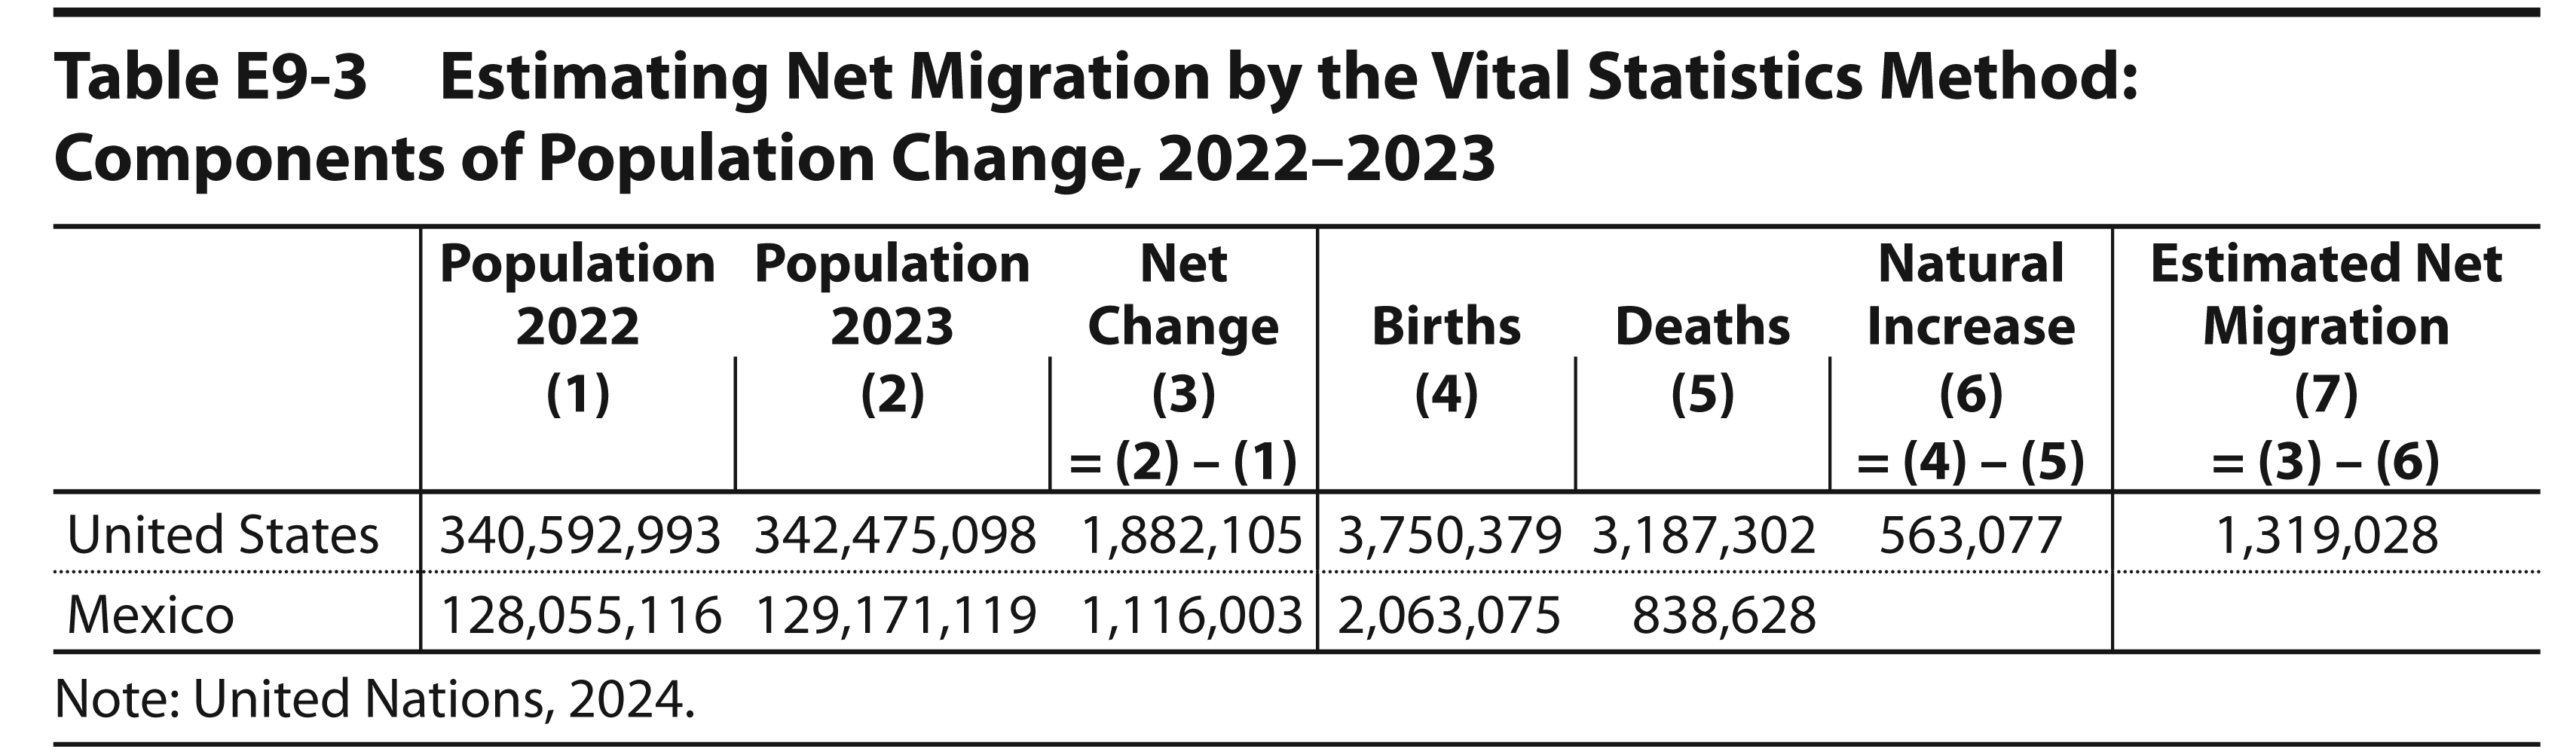
a. How does migration reinforce or offset natural increase in each country? Use the values in the table to explain your answer.
b. Which country is experiencing net in-migration and which is experiencing net out-migration?
c. Calculate the crude rate of net migration for each country using the midyear population as the denominator. (Use the average of the 2022 and 2023 populations to estimate the midyear population.) Which country had the higher crude rate of net migration, on average, from 2022 to 2023?
Table E9.3