Chapter 3: Population Growth
Exercise 1
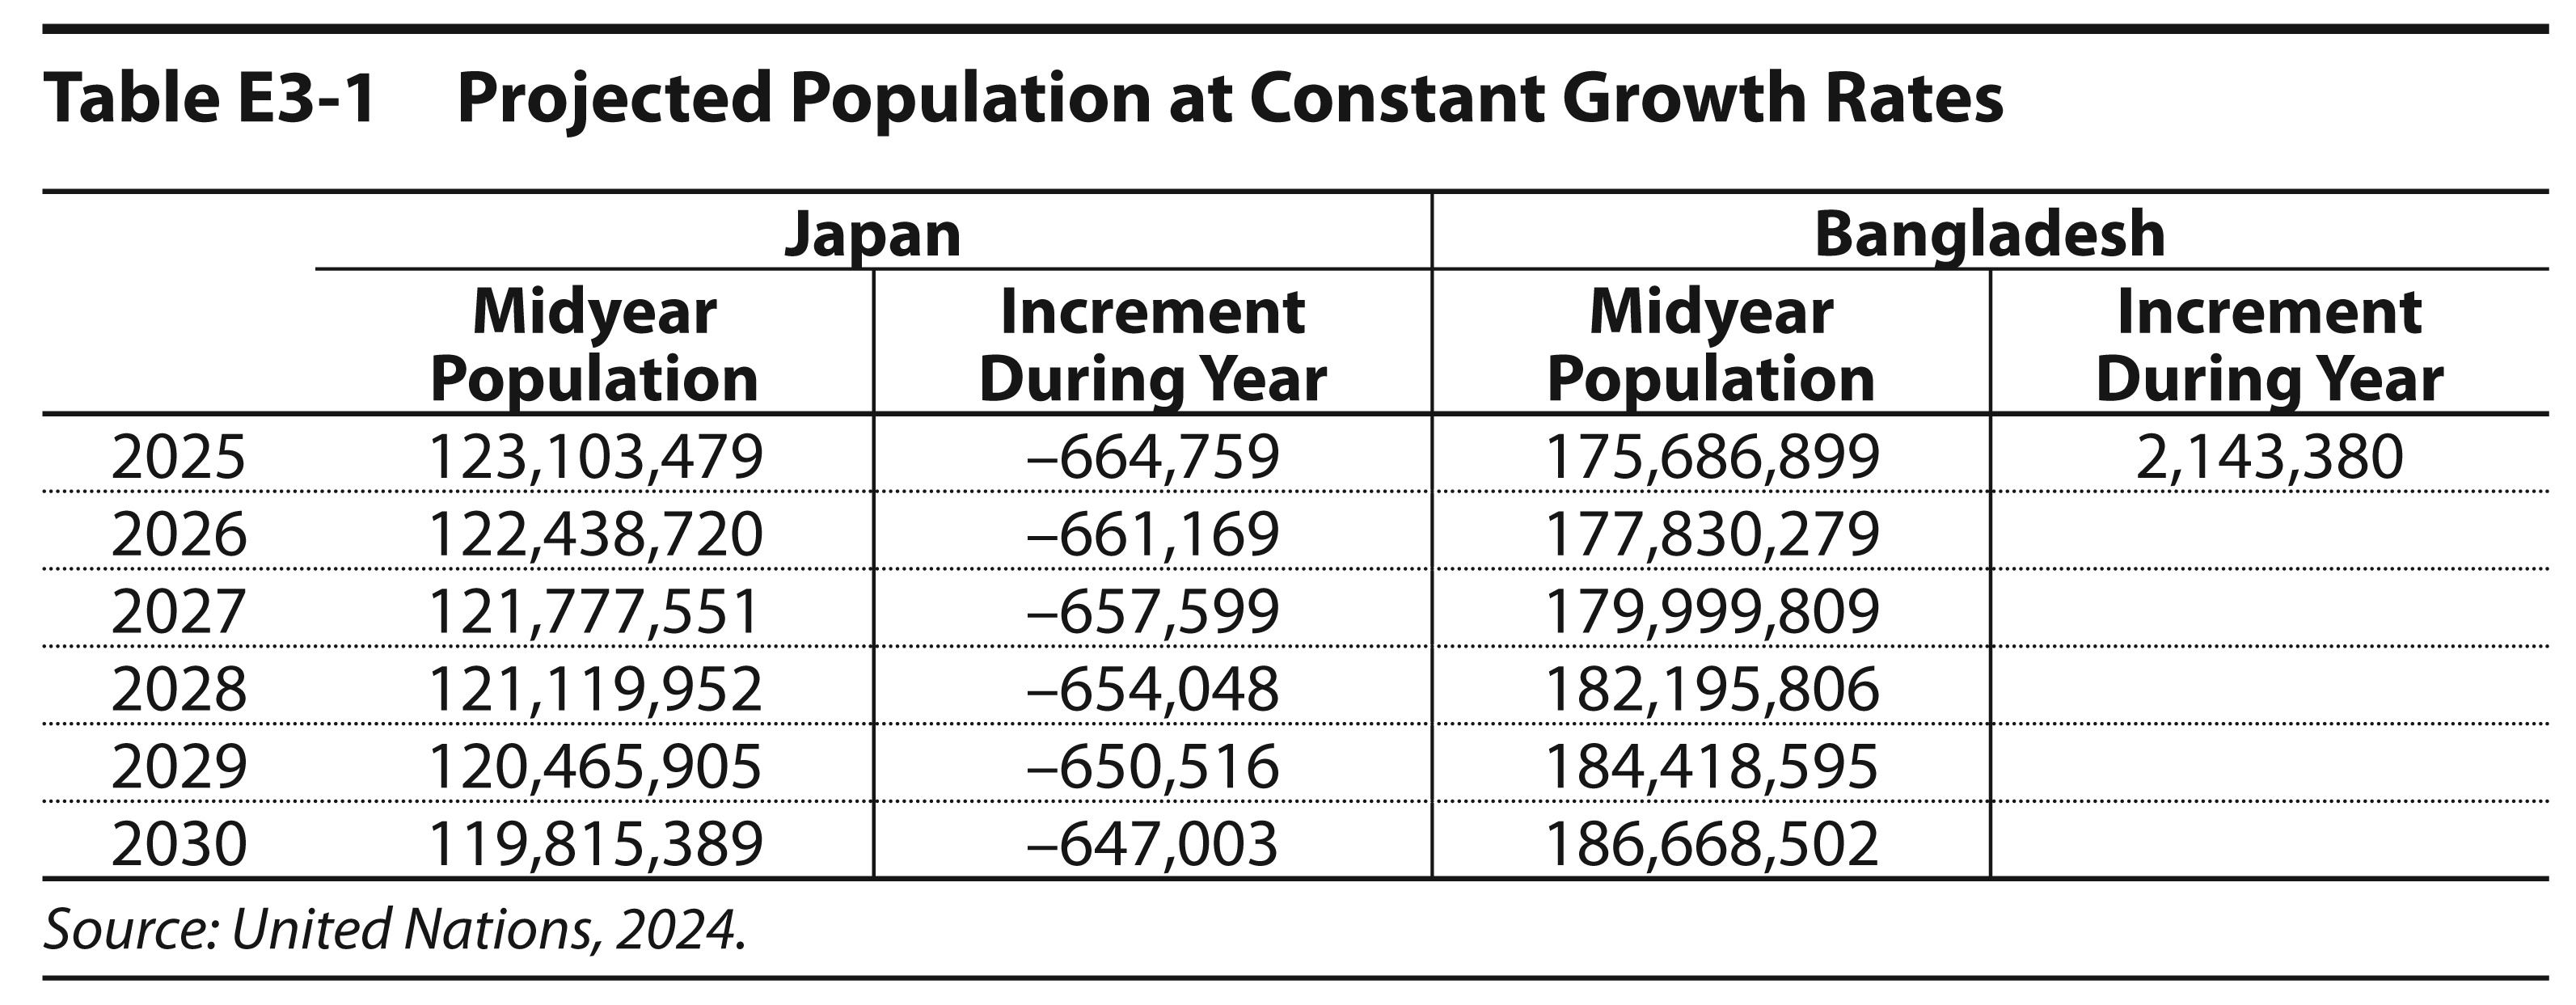
Table E3-1 shows what would happen to the current population of Japan starting at 123,103,479 at the midyear of 2025 and decreasing by its current rate of –0.54% (i.e., 5 per thousand or .0054) every year until midyear through 2030. Copy the same procedure and apply it to Bangladesh, filling in the blanks in the table. Assume an annual growth rate for Bangladesh of its current 1.22% (i.e., 122 per thousand). Figures are provided for the year 2025 to get you started. Round off the increment figure to the nearest whole number before adding it to the population as of the beginning of the succeeding year.
Exercise 2
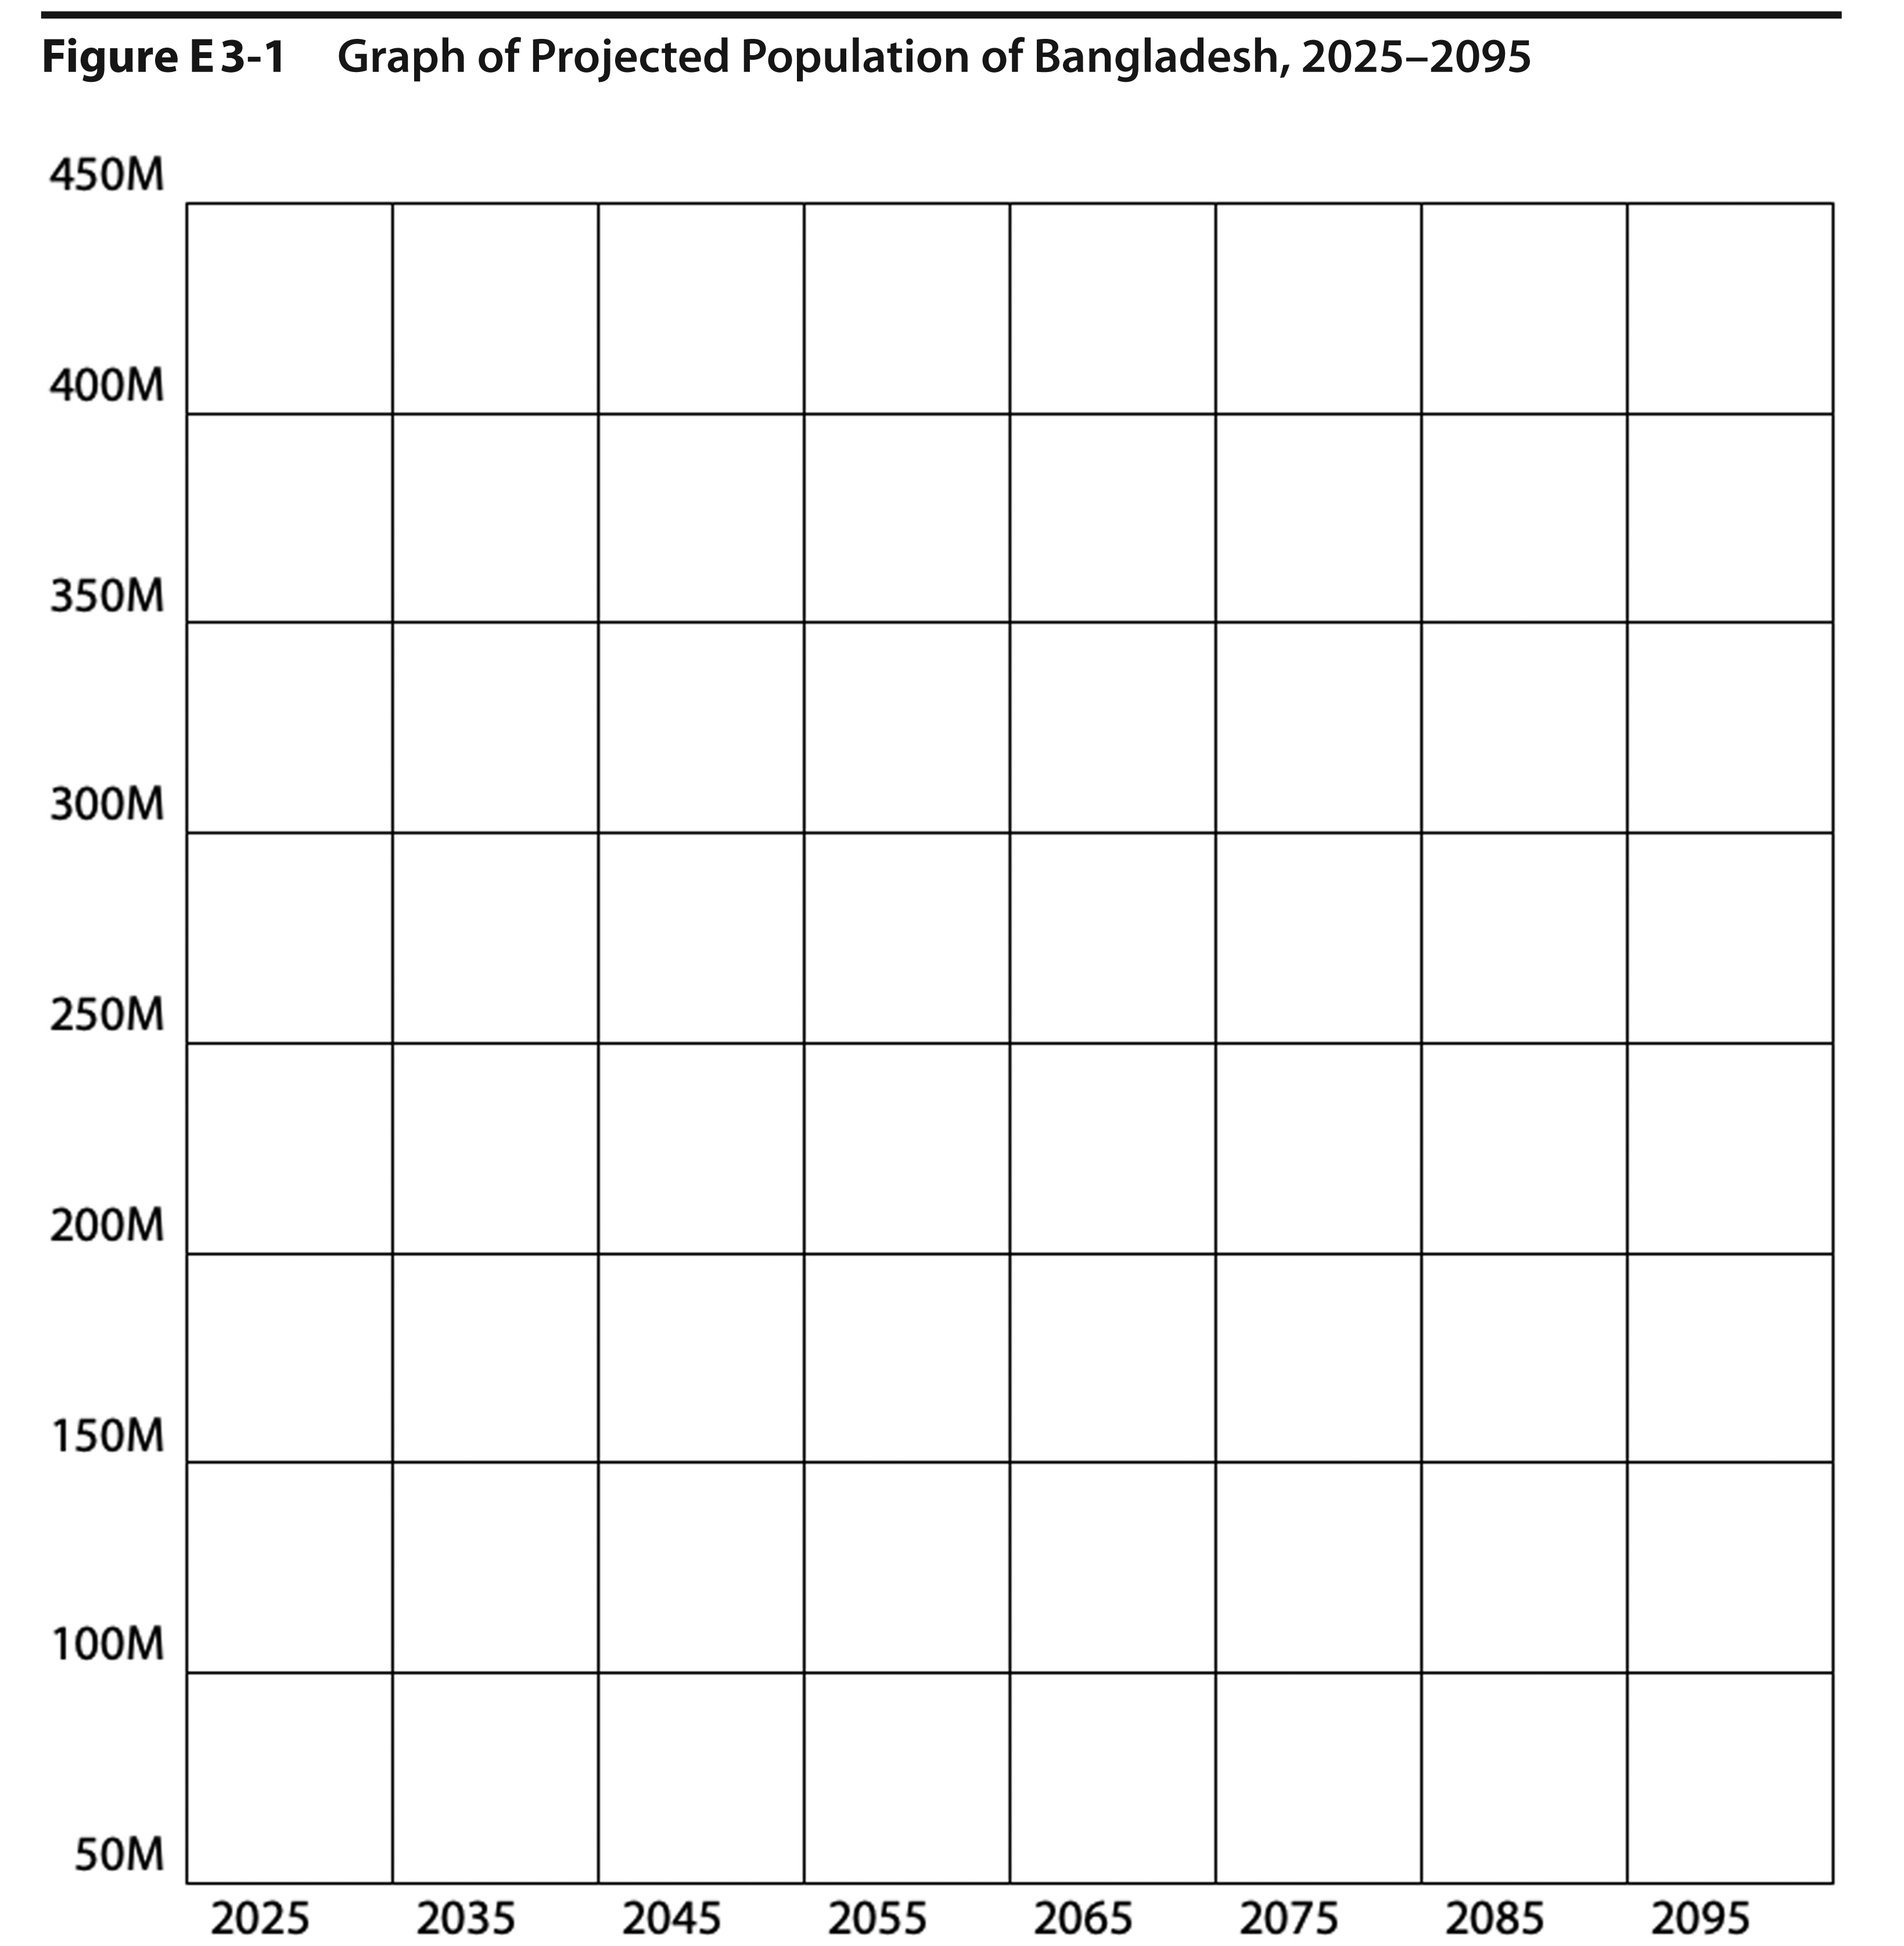
Assuming constant growth, plot the projected population of Bangladesh for every twenty years from 2025 to 2095 in Figure E3-1. Connect the dots with a freehand line.
It may be easiest to calculate the annual growth using a spreadsheet since you will need to calculate the annual growth each year in order to calculate the 20-year estimates.
Exercise 3
The implications of a constant growth rate can be expressed dramatically in terms of the years to double at that rate. The formula is:
At current annual growth rates for Mexico and Burundi, 0.7% and 2.7% respectively, how many years will it take for the populations to double? Round to one decimal place.
- Mexico doubling time __________ (years)
- Burundi doubling time __________ (years)
Exercise 4
The graph below shows carbon emissions over time for Brazil, China, the United Kingdom, and the United States. On the Y-axis, select “Cumulative CO2 Emissions,” and on the X-axis, select time (years) from 1800 to today. Click play and describe the trends you see. Next, change the Y-axis measurement from cumulative emissions to emissions per person by selecting “CO2 Emissions Per Capita” and click play. Describe the trends you see compared to the previous example. Now, do the same comparing “Material Footprint” to “Material Footprint per Capita” on the Y-axis.
Note:
1. These X-axis selections can be found under the Environment folder
2. For easier country comparison, reduce the size of the country bubbles under Options
3. Adjust the scale for easier trend comparison by using the zoom function under Options